Inaugural Art in Research exhibit showcases cutting-edge illustrations in biomedical research
Nearly 30 Weldon School graduate students submitted images (photography, micrographs, illustrations, visualizations and renderings) that depicted their research, along with a description on how the image was created and how it represents the importance of research in their field.
Faculty voted on the top images in six categories, and the following were selected as winners:
Best Microscopy
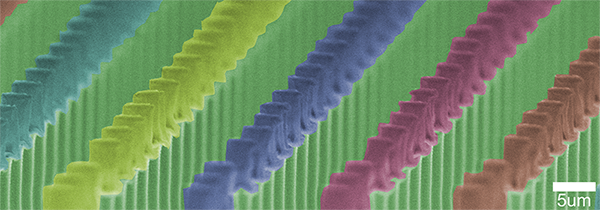 |
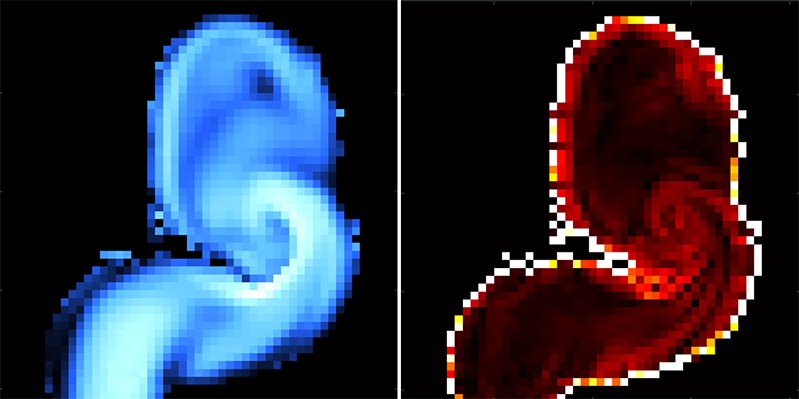
Best Modeling
 |
Submitted by: Conner Earl
Contributors: Luke Schepers; Sydney Clark
Creation: This image was created in MATLAB from two 4D Ultrasound images taken prior to inducing a surgical heart attack and 28 days after the heart attack. The 4D Ultrasound images were taken using a VevoLab 3100 (FUJIFILM VisualSonics). The top images are polar plots of the mouse left ventricle depicting wall thinning while the lower images are spatiotemporal maps representing Green- Lagrange circumferential strain.
Caption: The images shown are representative images of a mouse heart before and 28 days after a heart attack. The upper left circular image is a polar plot that represents a healthy heart without any injury. The lower left plot represents the motion of the heart and the even, solid yellow line in the middle indicates healthy motion. The plot on the upper right shows where the heart attack occurred (blue), and the lack of yellow in the bottom right image shows how poorly the heart was moving. The image is meant to be a tribute to the sacrifice mice make in advancing the field of research and represents the "sunrise and sunset" of this particular mouse's life.
Best Rendering
 |
Best Hand Drawn
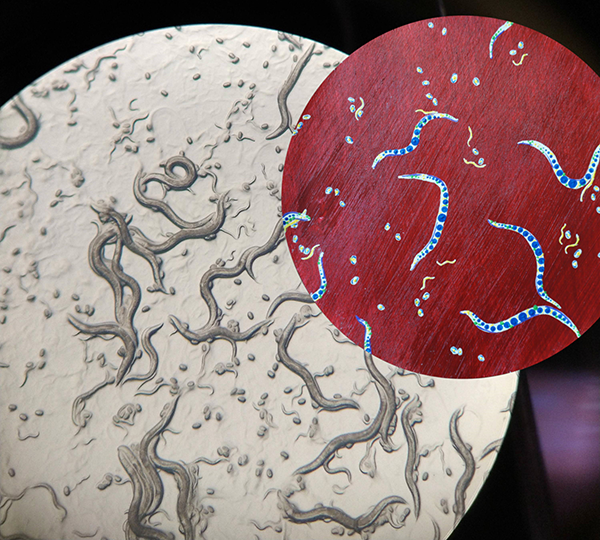 |
Title: Nematode Caenorhabditis Elegans: Viewed through the Microscope and Re-imagined in Acrylic
Submitted by: Nissa Larson
Creation: The image was taken with my smartphone through the eyepiece of a microscope. The colored section was acrylic painted by hand and intended to align with the image. For reference, adult nematodes are approximately one millimeter in length.
Caption: This image, depicting nematode species C. elegans, was taken during my undergrad research with mentor Tian Qiu in Nathan Schroeder’s lab at the University of Illinois Urbana-Champaign. The nematodes shown are living on a specialized, peptone-free growth medium, as we believed that the normal growth medium may have been altering the amino acid analysis results in previous experimentation. Simple images such as this were taken to track and convey growth stages of the nematodes. Although they were largely drab in coloration, the nematodes daily lively action always brightened my day. I enjoyed conveying them in this manner.
Best Device Design
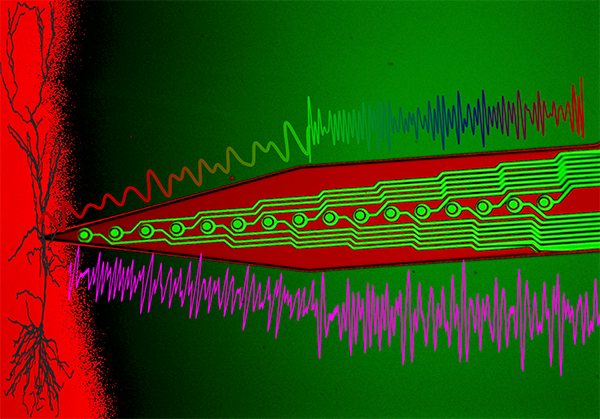 |
Title: Dream Waves
Submitted by: Hammad Khan
Contributors: Om Kolhe
Creation: Brightlight microscopy, ImageJ, Powerpoint, Illustrator
Caption: Cutting-edge technologies can enable exquisite understanding of the most complex organ in the human body – the brain. The building block of which is called a neuron. These neurons emit constant electrical waves to which provides the basis of how our brain coordinates activities. These waves change as a function of our own cognitive states. However, understanding the interactions of single and grouped neurons during various behavioral functions still require advanced technologies. Once such way is to develop scalable and flexible multi-electrode arrays in an attempt to record from groups of neurons during active – awake states, or inactive – dream states.
Best Anatomy and Physiology
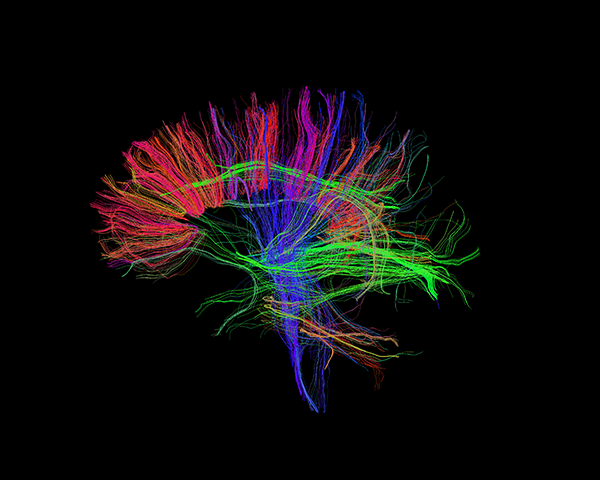 |
Title: Mapping of Human Brain Connectivity Using MRI
Submitted by: Antonia Susnjar
Contributors: Yukai Zou
Creation: The image was created based on Diffusion Tensor Imaging (DTI) data, a functional Magnetic Resonance Imaging (MRI) technique, collected at the Purdue MRI Facility using 3T GE Discovery MR750 scanner. DTI uses anisotropic diffusion to estimate the axonal white matter organization of the brain. The image above represents 3D reconstructed fiber tractography to assess white matter tracts. We used several open-source software such as FSL and MRTrix3, as well as customized MATLAB scripts.
Caption: The image depicts a 3D representation of white matter tracts connectivity in the human brain. The image was acquired with Diffusion Tensor Imaging, an advanced MRI technique used to assess complexity of the brain networks and dynamic changes caused by the range of neurological diseases or disorders. The technique described is used to monitor treatment responses for clinically diagnosed PTSD military veterans. In medical practice, DTI is used to detect brain damage caused by the ischemic stroke, seizures brain tumors, and multiple sclerosis.