
In this paper, we present ViSER, an interactive visual analytics platform that visualizes supply chain data for enabling eco-conscious redesign. ViSER provides a visualization dashboard consisting of multiple mutually coordinated views that provide different perspectives on a particular supply chain scenario. Our platform allows users to visualize a change propagation metric associated with a particular redesign path. Hence, the user can balance the advantages of a redesign opportunity with the risk associated with its effect on the rest of the supply chain. Furthermore, ViSER offers lifecycle data representations that inform users’ decisions particularly in the context of eco-conscious redesign. Coupling such environmental data with graph-based visualizations of product architecture, ViSER provides a novel decision platform for designers with a range of expertise levels. To demonstrate its utility, two use-case scenarios, from both a novice and expert perspective, are presented in detail.
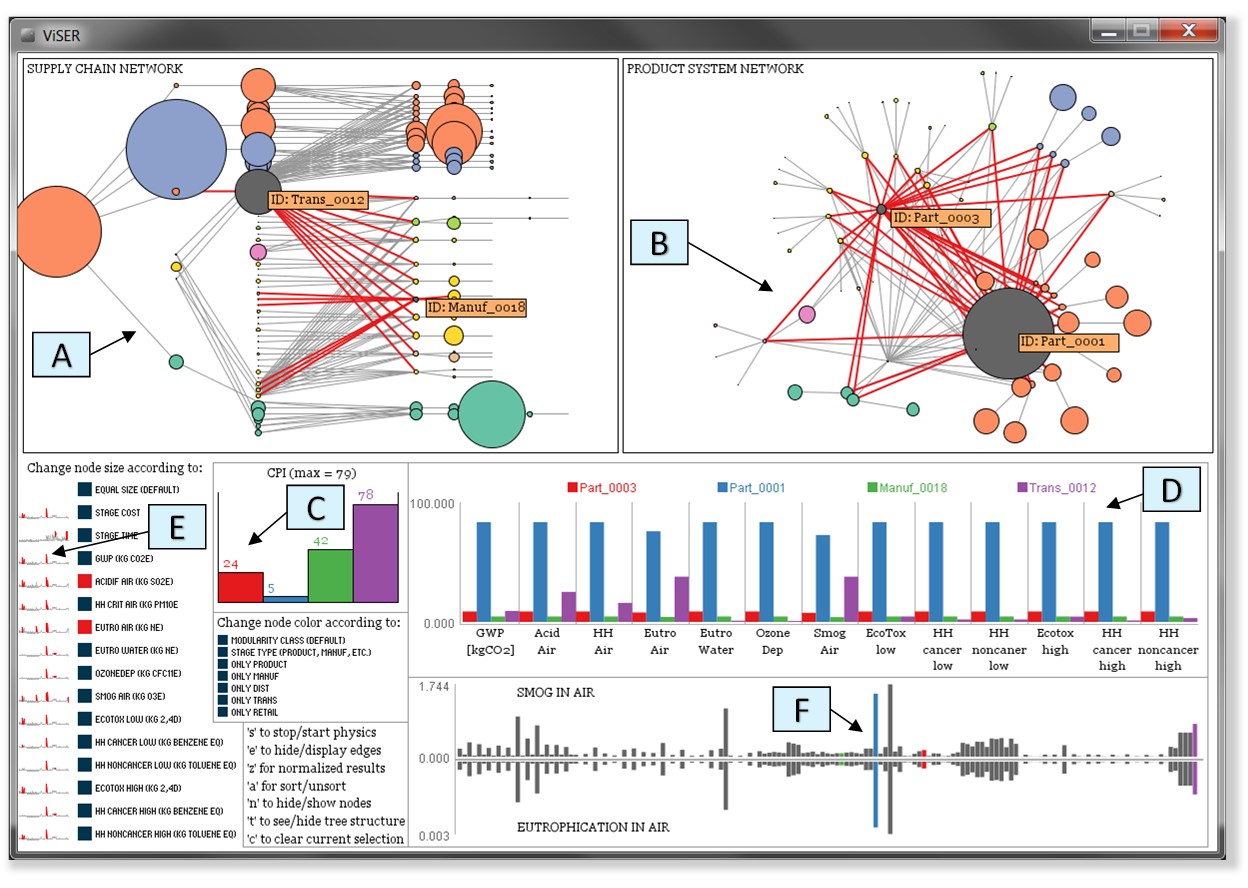
We present a screenshot of the ViSER tool. The supply chain shown is representative of the peripheral computer equipment industry. Each callout points to a specific feature of the ViSER platform and are described as follows: (A) a directed graph that represents the supply chain network as the edges connected to the selected nodes are shown in red, (B) a representation fo the product system graph oriented by a combination of force directed physics and user manipulation, (C) change propagation results for selected nodes of interest, (D) a comparison chart of impact categories for selected nodes of interest, (E) sparklines for each criterion with outliers shown in red and (F) the profile of selected node attributes, e.g.\ time and smog. A video demonstration of ViSER can be found here: http://youtu.be/pDJAqW9H3ME.
Demo video: http://youtu.be/pDJAqW9H3ME
