Lyles School research helps build interactive flood vulnerability maps
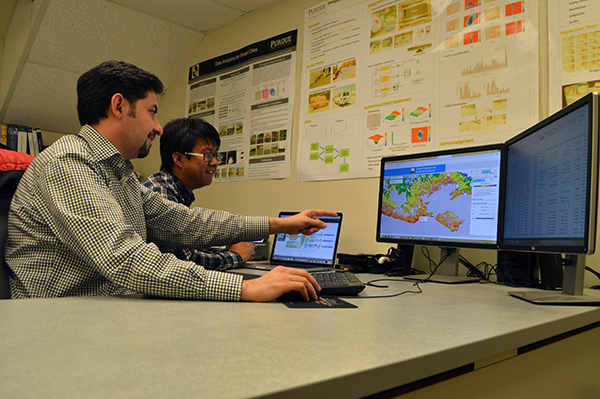
Assistant Professor Mohammad Jahanshahi and PhD candidate Fu-Chen Chen review the data, which includes thousands of structure images throughout coastal Louisiana.
Purdue civil engineers have developed a program that will allow the public to see exactly how vulnerable their homes are to floods, the world's most common and costly natural disasters.
Mohammad R. Jahanshahi, assistant professor in the Lyles School of Civil Engineering, says that with the expected climate changes for the next century, including sea-level rise, assessing flood risk is vitally important in order for coastal area residents and governments to make effective decisions about risk mitigation.
"Floods are the deadliest natural disasters we face," Jahanshahi says. "So, we believe it's important for communities to better understand just how vulnerable their neighborhoods and their individual homes are."
As part of the vision for "smart cities," Jahanshahi's team has been developing a framework to provide citizens with interactive flood vulnerability maps through a website. The user can insert their address and learn about the flood risk in their region. To this end, the team has developed a framework to obtain information regarding buildings through measurements obtained from publicly available imagery that is from Google Street View, GIS imagery and satellite imagery. The framework includes data such as building type, foundation type and height, square footage and number of stories. The information is used to predict structural flood risk characteristics.
The result, Jahanshahi says, is a "heat map" for flooding that will allow people to see an accurate vulnerability assessment for their community. Additionally, the map could be a valuable tool for emergency-response teams to see which areas they should prioritize in a flood event.
Jahanshahi's team collaborated with an interdisciplinary team of Purdue researchers that included David R. Johnson, assistant professor of industrial engineering and political science, and Ed Delp, professor of electrical and computer engineering. They used the city of New Orleans as the basis for flood mapping research — a city that has historically seen some of the worst flood damage in America, most recently from the effects of Hurricane Katrina in 2005. The team worked with the Louisiana Coastal Protection and Restoration Authority and compiled thousands of publicly available images to complete its first report.
PhD candidate Fu-Chen Chen says the research has been grueling, but now that they have created a system based on their work, applying it to future cities will be far more streamlined.
"I believe we collected data from around 800,000 buildings in just five days — and some of them did not have current structure information," Chen says. "But, in the end, we managed to successfully collect all the necessary data."
Jahanshahi adds, "As you can imagine, this was a very time- and work-intensive project. We have shown how Big Data and advanced artificial intelligence techniques can help tackle grand challenges in engineering."
The two-year project, which wrapped up in spring 2019, was funded by the Mellon Foundation. The findings will be published this year.