I had been using AI techniques in systems papers for the past few years, with fruitful collaborations with AI/ML faculty members. Those works had been appearing in systems or security or dependability venues. This time the situation is flipped — this is work done with an ML colleague, David Inouye, and part of two funded projects (by Northrop Grumman and the Army Research Lab) where the key contribution is in an ML technique and so it is going to appear in NeurIPS 2020.
Here’s the official lowdown on the paper:
“Feature Shift Detection: Localizing Which Features Have Shifted via Conditional Distribution Tests,” Sean M. Kulinski, Saurabh Bagchi, and David I. Inouye. Accepted to appear at the 34th Conference on Neural Information Processing Systems (NeurIPS), pp. 1–11, 2020. (Acceptance rate: 1900/9454 = 20.1%)
It has taken me a while to get off the heady feeling of getting into a club that I had only eyed avariciously from the outside, like a kid peering into the store window with prized desserts. But let me take you along to the key novelty of the work and why I am very bullish that this sets the foundation for a productive line of work by us in our ARL Assured Autonomy Institute (A2I2), and also broadly by the community working in “ML for security”.
Problem Context
The problem context is startlingly simple and old. We have a sensor network with many sensors, sensing things like air pressure, or in a defense context, pressure of a vehicle (like a tank) going over it. So a time series of multi-variate sensor data is coming along in a streaming manner. Now, some of the sensors have been compromised by the bad guys and so if we do not do anything about them, the inferencing that we will make on the sensor data is likely to be wrong. So we want to do three things:
- Detect that some compromise has happened
- Localize which sensor(s) have been compromised
- Determine when in the time series the compromise happened (so that we can do some boots-on-the-ground investigation say)
Historical Context
The problem of anomaly detection has a rich history and many wonderful solutions. The problem of anomaly localization is less well traversed but there are still some compelling solutions. Doing them in the context of time series, with multiple sensors, has so far lacked a satisfying answer. Satisfying means that the computation requirements should be sane, because we may want to do them in the a CPS scenario where the nodes are quite resource constrained.
Our Solution
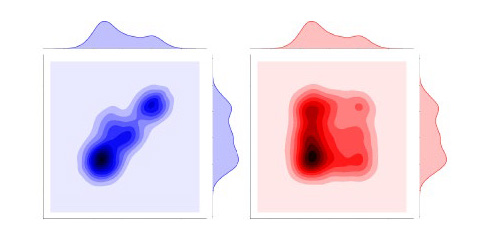
We had the insight that the sensor values are correlated in some form among themselves. So if the adversary can compromise some of the sensors, but not all, then it will not be able to faithfully mimic all the correlations. Note that these correlations are not available to us a priori and we have to learn them through training, over a period where there is some certainty that the environment is benign. Hence, we want to do hypothesis test on conditional distributions of sensor values — null hypothesis will say conditional distribution before time point T1 is the same as the conditional distribution after T1. The two figures below capture this intuition. The two figures below capture this intuition.

Expected Conditional Distance Measure: A Fisher Divergence Test Statistic
Then was the mathematical magic in devising a way to compute a test statistic that can be used for efficient hypothesis testing. I use the term “magic” in the very scientific sense that I had no idea how to come up with this and I barely understood it once the magic was done and that too because Sean and David painstakingly explained it to me.
This was the Fisher divergence test statistic via a score function. We used it for a purpose it had never been meant for — the purpose of the score function (which is defined as the gradient of the log density) is to estimate distributions with intractable normalization constants. In our use of this test statistic, it satisfied two important properties.
- Multiple features’ test statistics can be computed simultaneously. Hence, we can scale this approach to as large a sensor network as you would want to throw at us.
- Easy to compute for deep neural density and online learning models. Only a single forward and backward pass is needed to compute all conditional score functions corresponding to all the sensors.
Does it Work?
Of course it does, otherwise we would not be here bragging about a NeurIPS paper. But for the disbelieving, please read the paper. We show that our approach has high recall and precision in detecting and localizing the compromised sensors and the point in time when the compromise happened (though in this last aspect, we are on somewhat shaky ground). We do this with different strengths of the adversary. We do this with synthetic datasets. We do this with three real-world datasets: a UCI appliance dataset (different appliances in a house are being sensed), a UCI gas sensor array dataset (different sensors laid out in an array are expected to have correlation), and a very topical Covid-19 dataset (the time series of the number of new deaths from COVID-19 for the 10 states with the highest total deaths as of September 2020).