Tools Developed by the Indiana Watershed Leadership Program
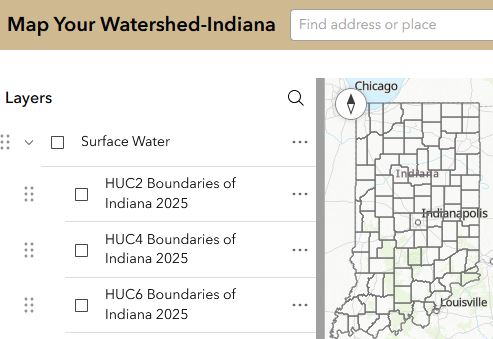
Map Your WatershedProvides easy access to data from IndianaMap about Indiana's water resources and the land features and human activities that may affect them. It was made for people who may not have experience with online mapping to discover and visualize information. Poster about Map Your Watershed List of layers included in Map Your Watershed |
|
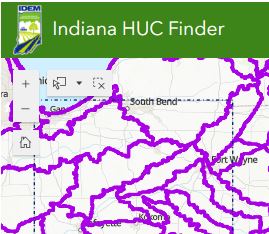
Indiana Finder ToolsNote: Originally developed at Purdue University, the "Finder" tools are now managed by the Indiana Department of Environmental Management. Indiana HUC Finder - Find the 8, 10, and 12-digit hydrologic unit code (HUC) for any location. Also shows the older 11 and 14-digit HUCs on the same map. Indiana Watershed Group Finder - helps you find active watershed groups anywhere in Indiana. |
|
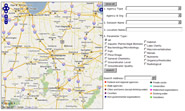
Indiana Water Monitoring InventoryDiscover who is monitoring what parameters in Indiana. This metadata tool does not contain actual data but points you to data holders. Developed in collaboration with the Indiana Monitoring Council. Read the Fact Sheet. |
|
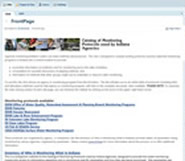
Catalog of Monitoring Protocols Used By Indiana AgenciesFind out how Indiana agencies are monitoring water. This wiki-based tool provides links to many protocols not previously online.
|
|
Other Useful Tools for Watershed Leaders |
|
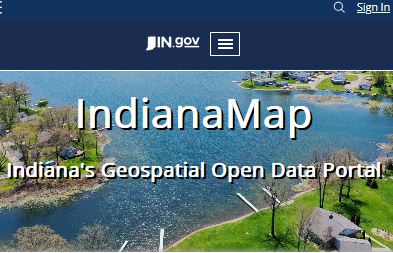
Indiana MapProvides more than 200 spatial data layers through a web-based interface. Hosted by the Indiana Geographic Information Council.
|
|
Web Soil SurveyTool for determining detailed soil properties for areas less than 10,000 acres. Developed by the USDA Natural Resources Conservation Service
|
|
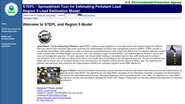
USEPA Pollutant Load Estimation Tool (PLET)Uses your data to calculate estimates of nutrient and sediment loads and load reductions that result from implementation of various conservation practices. This is the successor to Region 5 and STEP-L.
|
|
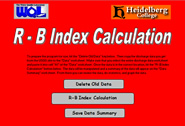
Richards-Baker Flashiness IndexThis spreadsheet tool uses daily stream flow to quantify the frequency and rapidity of short-term changes in stream flow. Developed by Peter Richards and David Baker, Heidelberg College. |
|
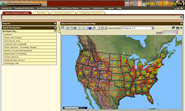
StreamerVisualize and understand water flow across America. Streamer allows you to trace America's larger streams upstream to their source or downstream to where they empty. Streamer is fueled by fundamental map data for the US at one million-scale from the National Atlas. |
|

If you have corrections or other suggestions, please contact Jane Frankenberger, Purdue University.