Scripts, Plots and Selection Structures: Potentiometer and LED Control
This in-class activity guides students through creating a MATLAB script that reads data from a potentiometer, an LED based on the measured voltage.
Purpose of project
Imagine you are part of a design team developing a smart lighting system that adjusts brightness based on environmental conditions. Your goal in this activity is to prototype a simple control system using an Arduino and a potentiometer. The potentiometer simulates a light sensor whose voltage level determines whether an LED should turn on or off.
You will write a MATLAB script that reads the potentiometer voltage, uses selection structures (if/else) to make a decision and produces a plot of the measured voltage over time. Through this activity, you will practice professional programming standards by organizing code into sections, labeling variables and visualizing results while learning how sensors and control logic are combined in real-world engineering systems.
Your Task
Your task is to demonstrate that you can use MATLAB to control the Arduino and analyze the behavior of your prototype.
You must accomplish the following:
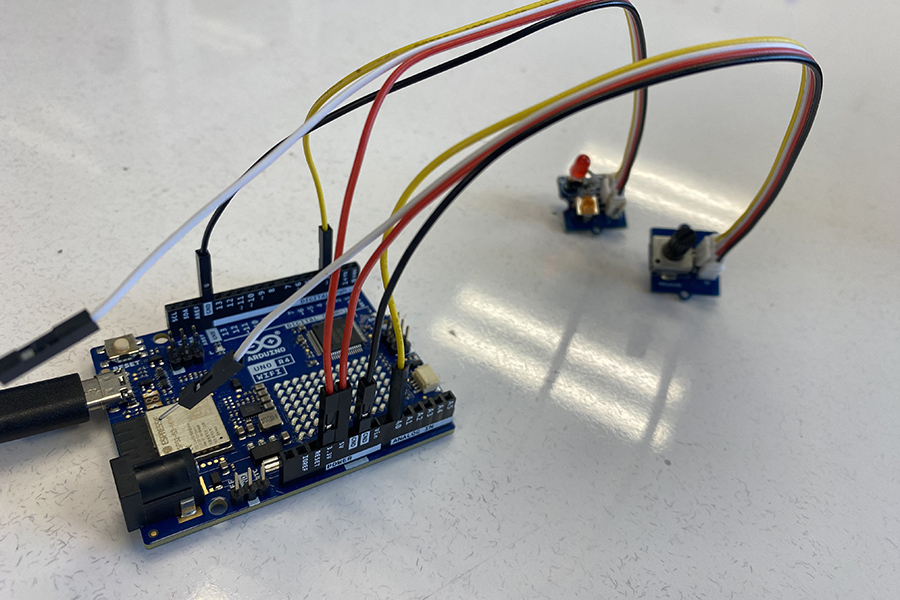
- Connect the potentiometer and LED to the Arduino as shown in the circuit diagram.
- Write a MATLAB script that reads the analog voltage from the potentiometer using read Voltage(a,'A0').
-
Use an if/else selection structure to decide when the LED should be ON or OFF:
- 0 – 2.5 V → LED OFF
- 2.6 – 5.0 V → LED ON
- Display the measured voltage and LED state in the Command Window.
- Create a plot of the measured voltages with a proper title, labeled axes and a grid.
- Save and submit your MATLAB script, the voltage plot (.png) and a screenshot of your Command Window output.
Organizing work
- Clearly label figure axes and titles in MATLAB
- Include comments and section headers in the script to show clear organization
- Insert the circuit diagram, final MATLAB code and a picture of the Arduino setup into the Word file
- Combine the MATLAB figure (.png) and Word file into a single submission when possible
Submission instructions
Complete this assignment as a team. One team member must submit work on Gradescope, listing each member in the submission process. All team members should review and approve the submission.
Deliverables
-
PDF file (include circuit diagram, final MATLAB code, voltage plot and a picture of Arduino setup)
- Name the PDF file: ENGR132_ICA_PotSelection_LastNames.pdf
- Submit all files through the designated Gradescope assignment.
Background / Technical Content
Light-emitting diodes (LEDs) are widely used in electronic systems due to their efficiency, fast response and long lifespan. They are ideal for demonstrating basic control systems in engineering applications, where brightness or on/off behavior can be adjusted based on sensor inputs. In this activity, a potentiometer acts as an analog sensor that changes voltage and a selection structure (if/else) in MATLAB determines whether the LED turns on or off. This concept models how automated systems make decisions based on real-time sensor data, similar to smart lighting or feedback control systems used in industry.
The first visible LED was demonstrated in 1962 by Nick Holonyak Jr., emitting red light using gallium arsenide phosphide. Continuous advances in semiconductor materials have since expanded the color range and improved efficiency, transforming LEDs from simple indicators into essential components in modern devices (Dupuis & Krames, 2008).
The ARDUINO UNO WIFI includes one built-in programmable LED (Figure 1):
The LEDs can be programmed in MATLAB using simple commands to read analog inputs and control digital outputs. By reading the potentiometer voltage through readVoltage(a, 'A0'), engineers can design logic that reacts to sensor values in real-time. For example, the LED on pin D3 can turn ON when the measured voltage exceeds 2.5 V and OFF when it is below that threshold, modeling a basic control system similar to an automatic lighting circuit.
In this activity, students will write a MATLAB script that applies if/else selection structures to make these decisions and will create a plot of the potentiometer voltage to visualize the system’s behavior. This hands-on exercise helps students connect programming logic, sensor data and output control — fundamental skills for building responsive engineering systems.
References
- Dupuis, R. D., & Krames, M. R. (2008). History, development, and applications of high-brightness visible light-emitting diodes. Journal of Lightwave Technology, 26(9), 1154–1171. https://doi.org/10.1109/JLT.2008.923632
- MathWorks. (2024). Read analog voltage from a potentiometer and control an LED using selection structures. Retrieved from https://www.mathworks.com/help/matlab
- Arduino. (2023). Arduino Uno Rev4 WiFi datasheet. Retrieved from https://docs.arduino.cc/hardware/uno-r4-wifi
Learning Objectives
|
Learning Objectives |
Did you address this? |
|---|---|
| MAT01 – Develop MATLAB code that follows professional programming standards (headers, comments and structure) | |
| MAT03 – Perform calculations and logical operations using relational and conditional statements | |
| MAT05 – Create and execute MATLAB scripts that combine calculations, logic and plotting | |
| MAT06 – Apply selection structures (if, else) to make decisions in code | |
| MAT09 – Test and track code to verify expected LED behavior for different voltage levels | |
| MOD01 – Model sensor behavior by interpreting potentiometer voltage as input data | |
| EPS01 – Communicate results professionally through labeled plots and clear written documentation | |
| EPS02 – Create professional-quality plots with appropriate titles, axis labels and units | |
| PC05 – Fully address all parts of the assignment by following instructions and submitting all deliverables |