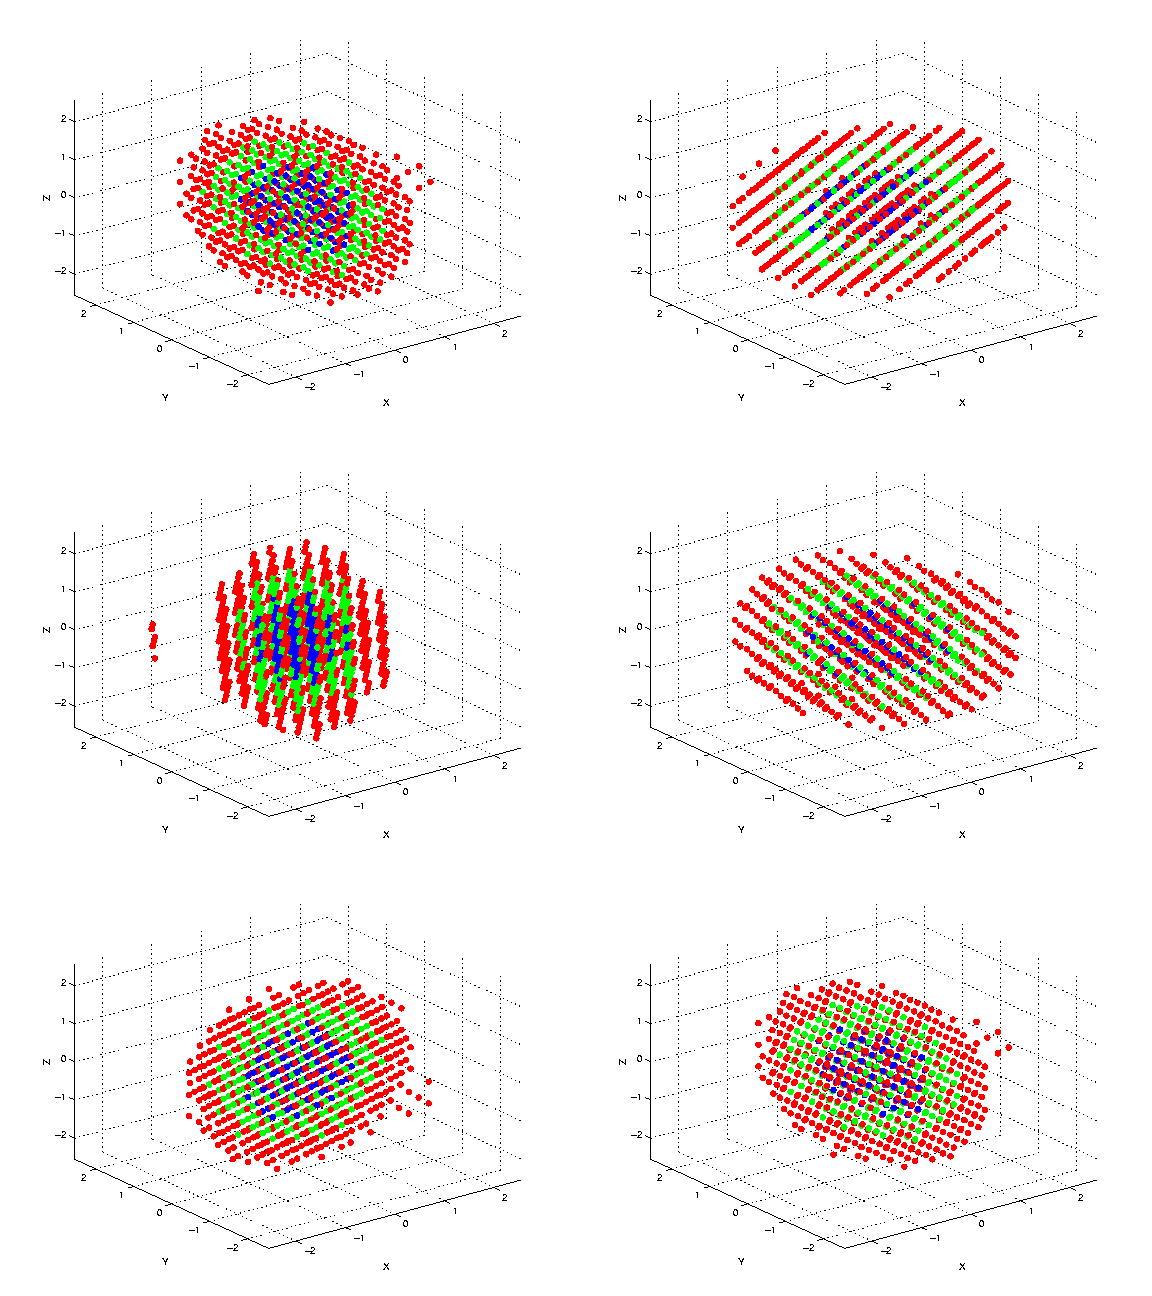
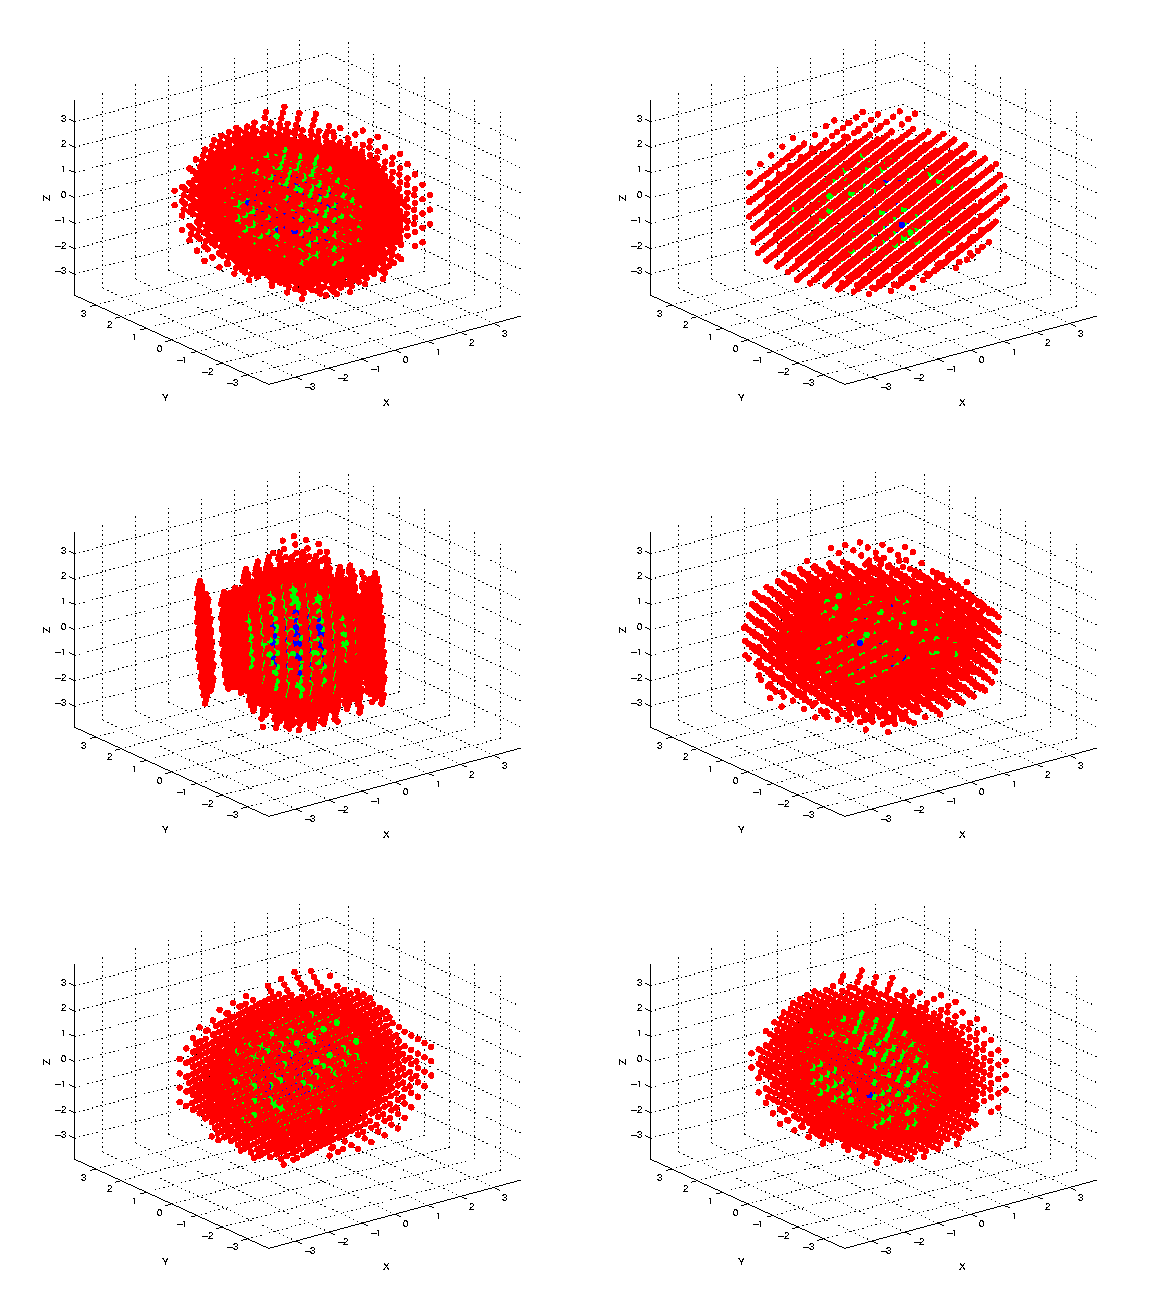
Quantum Dot Eigenstate Scatterplot.


The figures above show the isosurfaces of the ground state computed in an sp3s* tightbinding model of a cubic quantum dot of dimensions 7x5x3.5 nm. Three different isosurfaces are plotted at 60%, 35% and 12% of the maximum wavefunction value. The lower plot shows some asymmtery we are currently still investigating.
