|
| A NEW WEBPAGE IS AVAILABLE AT WWW.SARPROZ.COM |
|
|
| A NEW WEBPAGE IS AVAILABLE AT WWW.SARPROZ.COM |
|
|
| A NEW WEBPAGE IS AVAILABLE AT WWW.SARPROZ.COM |
|
|
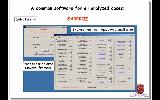
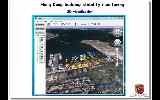
| Welcome to SARPROZ, a software tool written in Matlab for processing InSAR, PSInSAR, QPSInSAR and much more... (Alias Synthetic Aperture Radar Interferometry, Permanent Scatterers, Persistent Scatterers, Point Targets, Coherent Targets, Stable Points, …) |
|
|
| Features of Sarproz |
|
|
|
|
|
|
|
|
| List of the examples reported in the following slides. |
|
|
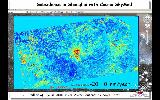
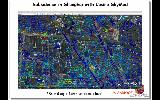
| Red is -20mm/year, blue is not moving (stable). The area is 40 by 20 sq km. |
|
|
|
|
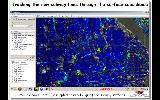
| The picture is a close up of the previous image on a small area. You can distinguish the subway tunnels that were newly excavated for the Shanghai Expo. In fact, the surface over the tracks shows a linear deformation (yellow-red), while the area around is stable (blue). Placemarks are in correspondence of subway stations. |
|
|
|
| An other close up in shanghai, to show the real position of the PSs. The previous slides showed resampled data, in this slide u see the locations as estimated by the PS technique. U can see eg that PS are very well aligned along streets. The color scale is the same as before. |
|
|
| If you apply the common PS algorithm on points on a skyscraper, you will find coherent points only at the bottom of the building. All other points on the building look like noise. In fact, the top of a high building moves with much more complex motions (thermal dilation, wind fluctuation and so on). With Sarproz, u can apply more complex motions to time series (like seasonal and non-linear trends estimation). Moreover, it applies more complex algorithms that exploit the correlation among close pixels. So, you can correctly reconstruct high structures. |
|
|
|
|
| In this slide u see the result of processing TSX data around the campus of CUHK. Color scale as before (-20 (red) 0 (blue) mm/year). The yellow area on the right corresponds to reclaimed land (there was the sea before, and they filled it with soil for making new buildings) |
|
|
|
|
| Sarproz has a module also for loading and visualizing optical images. In this example, some buildings in the HK harbor. You can navigate among PSs, select them, visualize time series and all the estimated parameters. Sarproz has a module also for estimating some target characteristics to understand which part of the building is observed |
|
|
| Then u can visualize the same targets in 3 dimensions (both in the visualization module of sarproz and in Google Earth) |
|
|
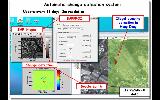
| An example of change detection in HK. The Lands department asked us to show the capability of SAR to detect changes. We found an illegal dumping of material in a pool of water. They used our analysis as proof of illegal operations. Sarproz has several functions to analyze and detect automatically changes in the radar reflectivity. |
|
|
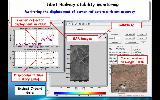
| Sarproz can detect changes also from time series. In this slide, u see 2 corner reflectors placed along the Tibet railway. Sarproz automatically find their location and the time of their installation. Then, u can process the phases of the images in which the targets are visible. And Sarproz detects a seasonal displacement, likely due to the dilation of Permafrost |
|
|
|
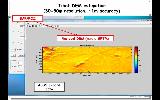
| A digital elevation model estimated by Sarproz with few L band images in Tibet. The image is the residual height w.r.t SRTM data. You can see the railway track on the left bottom. This image has been estimated by the Quasi-PS technique. In this area there are no Permanent Scatterers, but there is coherence. Sarproz analyses all possible interferograms and finds the coherent ones. Through those interferograms, the height can be estimated practically over all pixels. |
|
|
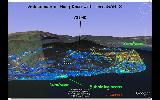
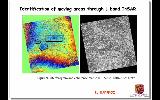
| Two SAR swaths over Tianjin, ALOS and TSX. Tianjin is affected by a strong non-linear motion. So, we can combine L and X band. L band covers a wider area, with long wavelength (~23 cm), longer revisit time (~46 days). X band can be focused on the most moving areas based on L band analysis. X and has shorter wavelength (~3cm) and covers a smaller area, but with higher revisit time (11 days). |
|
|
|
|
| With L band interferograms (with high coherence) we can detect fast moving areas (the rest of the fringes are atmospheric artefacts) |
|
|
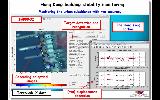
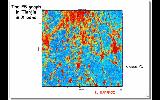
| Then we process X band data. The image here represented is the graph that connects all PS Candidates. Red ones are connections among true PSs. Blue connections reveal points that are not coherent, according to the classic PS algorithm. If red areas are not connected with eachother (because there are uncoherent points in between) then the PS algorithm fails: u cannot connect the graph and u cannot estimate the Atmospheric Phase Screen. So, we have to find other techniques to increase the density of coherent points. U can do this with the Quasi-PS technique, that exploits all possible coherent interferograms. In this way, almost all connections become coherent and u can solve the system of equations. |
|
|
|
|
|
|
|
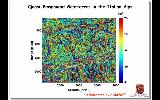
| This is a result of the QPS technique on the Italian alps. The height of the terrain is retrieved almost on all pixels in a mountain area covered by only few PSs. U can see a lot of details of valleys and mountains. Even if a slight misregistration is visible. |
|
|
|
|
|
|


