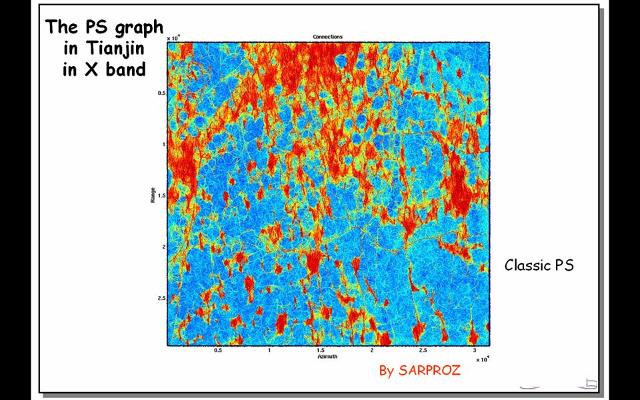
Then we process X band data. The image here represented is the graph that connects all PS Candidates. Red ones are connections among true PSs. Blue connections reveal points that are not coherent, according to the classic PS algorithm. If red areas are not connected with eachother (because there are uncoherent points in between) then the PS algorithm fails: u cannot connect the graph and u cannot estimate the Atmospheric Phase Screen. So, we have to find other techniques to increase the density of coherent points. U can do this with the Quasi-PS technique, that exploits all possible coherent interferograms. In this way, almost all connections become coherent and u can solve the system of equations.