 Webinars to Strengthen Watershed Management in Indiana
 Indiana Watersheds Webinar Series: Sharing experiences and ideas to strengthen watershed management
|
|
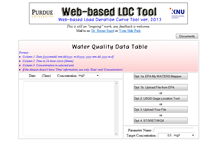
December 12, 2012 from noon to 1pm Eastern: Purdue Load Duration Curve (P-LDC) Tool Using WQX and USGS Data Flows Purdue University Agricultural and Biological Engineering Department (as part of an EPA NEIEN grant) has produced an online tool to provide map-based query to USGS streamflow gages for flow data, and to query USGS and EPA STORET databases for water quality data. In addition, users may upload their own properly formatted flow or water quality data instead of using online query. The tool can then produce Load Duration and Flow Duration Curve analyses. The tool can estimate annual loads using an embedded version of USGS LOADEST. Given specific targets the tool can superimpose the target curve on the observed curve. The superimposed curves will display what kind of flow regime is delivering the loads that exceed the target concentrations. An option then creates a list of BMPs (from the STEP-L database) which would be appropriate (and capable of producing the required reduction of pollutant load) to employ for that flow regime. The user will then need to select from various options based on the landuses in the watershed. This version does not include cost estimates for the BMPs. The tool is in the stage the developers consider “Public Beta” and they welcome feedback. |
|
Presenters
|
Bernie Engel, Professor, Agricultural & Biological Engineering and Larry Theller, GIS Systems Specialist, Purdue University |
| Webinar Information | Presentation slides (in pdf) Watch the recording - due to technical difficulties, we were unable to obtain a recording.
|
Tips for saving paper when printing pdf presentations:
To print multiple pages on each sheet of paper, download the file, click on "File" then "Print". Under Page Handling, select Page Scaling, then print multiple pages per sheet (i.e., 6 or 9 pages per sheet).