JTRP Trailer Cam


Success Story #1
Graphical Performance Measures for Practitioners to Triage Split Failure Trouble Calls
Detector occupancy is commonly used to measure traffic signal performance. Despite improvements in controller computational power, there have been relatively few innovations in occupancy-based performance measures or integration with other data. This paper introduces and demonstrates the use of graphical performance measures based on detector occupancy ratios to verify potential split failures and other signal timing shortcomings reported to practitioners by the public. The proposed performance measures combine detector occupancy during the green phase, detector occupancy during the first five seconds of the red phase, and phase termination cause (gap out or force off). These are summarized by time of day to indicate whether the phase is undersaturated, nearly saturated, or oversaturated. These graphical performance measures and related quantitative summaries provide a first-level screening and triaging tool for practitioners to assess user concerns regarding whether sufficient green times are being provided to avoid split failures. They can also provide outcome-based feedback to staff after making split adjustments to determine whether operation improved or worsened. The paper concludes by demonstrating how the information was used to make an operational decision to re-allocate green time that reduced the number of oversaturated cycles on minor movements from 304 to 222 during a Thursday 0900-1500 timing plan and from 240 to 180 during a Friday 0900-1500 timing plan.
INDOT's Research and Development Division provides specialized testing services in a variety of areas related to pavements and structures for data driven decision making and to minimize risks. These tests assist the department in warranty contract compliance, pavement designs, safety of Indiana roadways, and forensic investigations. To read more, click here.
Success Story #2
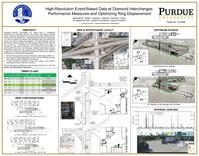
Offset and Sequence Optimization of Signalized Diamond Interchanges
Signalized diamond interchanges are unique pairs of intersections characterized by interlocked left turns and relatively close spacing between ramps. A diamond interchange has four external entry points (origins) and four external exit points (destinations). To effectively operate a diamond interchange, it is critical to examine the external origin-destination paths and evaluate their impact on the interior storage and progression. This paper describes a series of performance measures derived from high-resolution signal controller data that can be used to 1) qualitatively and quantitatively assess the quality of progression of the interior movements; and 2) optimize the internal offset to improve traffic flows within the interchange. Additional performance measures for identifying internal and ramp queuing are also discussed. There is general consensus in the literature that empirical performance measures are needed by practitioners to answer the following questions:
- Are the off-ramps queuing to the point that they impede freeway traffic? (5)
- Are the diamond interior approaches queuing to the point that they spill back and impede the adjacent intersection movements?
- Is there reasonable progression through both signals of the diamond interchange for the four external movements?
All three items above are affected by split allocation, but items 2 and 3 also rely heavily on the offset between intersections
Success Story #3
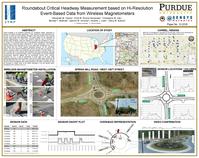
Roundabout Critical Headway Measurement based on Hi-Resolution Event-Based Data from Wireless Magnetometers
Critical headway is an important parameter for roundabout design, particularly in regards to analytical modeling approaches. Those models have been developed over the past 30 years and were typically developed using data obtained from manually reduced video and/or field observations. This paper reports on the application of wireless magnetometers to collect point presence detection used to calculate the rejected critical headways. Data was collected at a single lane roundabout in Carmel, IN. Carmel, IN is a community with over 70 roundabouts in operation for several years, representing a community highly experienced in using roundabouts. Over 260,000 entering vehicles were observed at one of the single lane roundabouts over a two week period with over 45,000 rejected headways analyzed. For the roundabout studied, 75% of the rejected headways were found to be less than 3.0 seconds. The rejected headways values were somewhat less than reported in NCHRP Report 572 and is perhaps due to the evolving driver familiarity with using roundabouts. Although this community has a particularly large number of roundabouts, the rejected headway characteristics observed suggest that as roundabouts become more common throughout the U.S., it may be appropriate to revisit some of the basic traffic engineering parameters used for analysis, much like the traffic signal community did with saturation flow rate in the 1990s. The techniques presented in this paper could be scaled to several roundabouts with varying geometrics and traffic to diversify the data set necessary to update some of the values developed in the last decade before roundabouts were common in the U.S.
Success Story #4
Purdue Coordination Diagram and Video Education
Signal offsets are a signal-timing parameter that has a substantial impact on arterial travel times. The traditional technique is to optimize offsets with an offline software package, implement the settings, and then possibly observe field operations. It is not uncommon for a traffic engineer to fine-tune the settings by observing the arrivals of platoons at an intersection and making adjustments to the offset from this qualitative visual analysis. This paper discusses two tools to assist the engineer in managing arterial offsets. First, it introduces the Purdue coordination diagram (PCD) as a means of visualizing a large amount of controller and detector event data to allow investigation of the time-varying arrival patterns of coordinated movements. The second technique is arterial travel time measurement by vehicle reidentification via address matching by Bluetooth media access control. This technique is used to evaluate existing offsets and assess the impact of implemented offset changes. These tools are demonstrated with a case study involving a before-and-after comparison of an offset-tuning project. PCDs were used to identify causes of poor progression in the before case, as well as to visualize both the predicted and the actual arrival patterns associated with the optimized offsets. More than 300 travel time measurements from Bluetooth probes were used for statistical assessment of before-and-after travel time. The statistical comparison showed a significant (at the 99% level) 1.7-min reduction (28%) in mean northbound travel time, corresponding to a 1.9-min reduction in median northbound travel time. Southbound travel times were not negatively affected by the offset changes.
Evaluation of Arterial Signal Coordination
Visual Eudcation Tools to Illustrate Coordinated System Operation


