SOP 11. Ventilation Fan Monitoring
April 2002
Introduction
This SOP describes the
procedures to follow for the continuous determination of ventilation rate in
mechanically ventilated livestock and poultry housing units. The method used
for evaluating housing ventilation rate will be the Fan Curve Method (FCM). In
this method, the status of fans is monitored (on/off), the static pressure is
monitored across a fan or fan bank, and the appropriate fan calibration data is
used to determine airflow rate delivery.
Equipment Needed
1. FANS monitoring system
2. SETRA Model 267 or Model
267MR static pressure sensor or equivalent
3. SETRA Model ______ power
supply
4. Fan status limit switches Telemecanique Model XCK-P106 (Grainger
Model 4B799)
(18.5 in-oz activating
torque)
5. NEMA 4X enclosure
6. Miscellaneous wiring
circuitry
Procedures
The FANS unit is to be calibrated as per BESS
Laboratories (University of Illinois-Urbana Champaign). Once calibrated, the
FANS unit becomes the calibrated sensor from which to calibrate all operating
fans under test.
All fans in a building will be calibrated a
minimum of three times in a calendar year. All calibration work in a housing
unit will be conducted after a close-out, once before fans are cleaned and once
after fans are cleaned. Each fan tested will be tested twice, separated by a
15-minute interval with simultaneous measurements of static pressure. The
average airflow delivery rate for each fan will be recorded, along with the
average static pressure measurement. This airflow versus static pressure will
be used in future calculations to determine airflow delivery rate. For each fan
a set of data will exist for dirty versus cleaned. Three static pressure levels
will be tested by artificially adjusting the fresh-air intake system. Static
pressures near 5, 25, and 45 Pa (0.02, 0.10, and 0.18 in wg) will be tested. A
linear regression equation will be developed to determine the fan curve for
each fan, both cleaned and dirty.
Fan Status Monitoring
The operation status for all fans in a
housing unit will need to be known. It is recommended that changes or
interception of signals from the existing fan control system not be used. Fan
status will be determined using limit switches either attached to existing fan
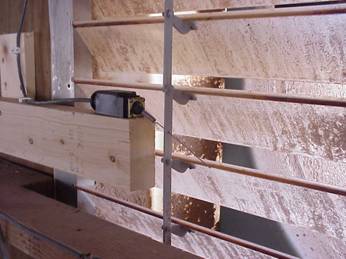
shutters or configured as a sail-switch.
If attached to fan shutters, whisker limit
switches are recommended. An example set-up using whisker limit switches
(Grainger Model 4B799) is shown below:


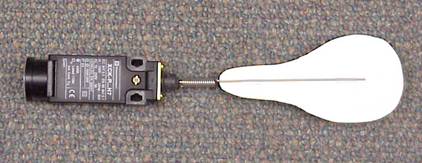
An alternative whisker switch
arrangement for fan airflow activation configured as a sail switch is shown
below (Grainger Model 4B804):
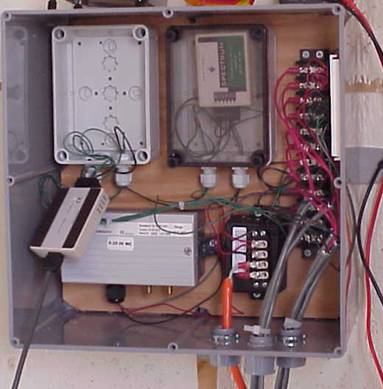
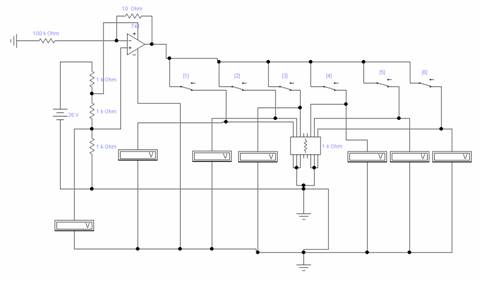
Field Installation
It is recommended that a NEMA 4X enclosure be installed in each barn to
provide the necessary wiring connections for all limit switches and the static
pressure sensor. An example enclosure and wiring connections are shown below:
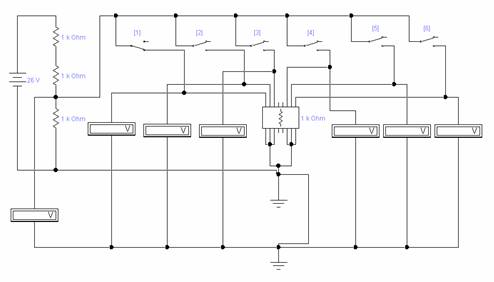
Limit Switch Wiring
A 2-conductor shielded 18 or 20 gage cable is
recommended for each limit switch. The static pressure power supply (SETRA
Model ______) delivers approximately 24vdc to the SETRA Model 267 (or 267MR)
static pressure sensor and can be used to provide the necessary power to record
limit switch operation. Two alternatives exist for wiring the limit switches. In
the first method, the voltage sensed from the fan sensor array will vary as the
number of operating fans varies. This method requires that the fan sensor
switches be recorded as true analog inputs. A second method yields a true
TTL-compatible signal requiring only that a digital input signal be recorded. The
first method utilizes more expensive analog input data acquisition equipment
but does give the user a better chance of determining proper operation of the
limit switches. Wiring examples are given below:
Method 1. Variable analog output with sequential fans in operation
Fan On: VDC
out: Fan On: VDC out:
0 0.0 1,2,3,4 2.4
1 5.2 1,2,3,4,5 2.0
1,2 3.7 1,2,3,4,5,6 1.7
1,2,3 2.9
Method 2. True binary output signal
Fan On: VDC out: Fan On: VDC
out:
0 0.0 1,2,3,4 5.2
1 5.2 1,2,3,4,5 5.0
1,2 5.2 1,2,3,4,5,6 4.2
1,2,3 5.2
Ventilation Rate Calculations
Airflow delivery rate for a housing unit will
be determined by:
1. Measuring static pressure
2. Recording fan status
3. Apply FANS calibration data
to operating fans
4. Determine housing unit
airflow delivery rate using:
Q = S { FCFi * Fani * (mi*DP + bi) } for Fans i = 1 to n
where
Q =
airflow delivery rate, m3/h (ft3/min)
FCFi = fan cleanliness factor (maximum=1.0, minimum determined from
dirty/clean fan performance)
Fani = individual fan status (0 = off, 1 = on)
DP = static pressure difference between room and outside, Pa (in
wg)
mi =
slope for regression equation developed using FANS, m3/hr-Pa (ft3/min-in
wg)
bi =
intercept for regression equation developed using FANS, m3/hr (ft3/min)
The
Fan Cleanliness Factor (FCF) is an estimate of the effect on airflow delivery
of dust build-up on fan blades, shutters, and grills. When cleaned at the start
of a grow-out period, the FCF=1.0. The FCF during the growth period will be
estimated using the following equation:
FCFi
= (1-EFi) * {(We – W) / (We – Ws)} + EFi
where
We =
ending animal weight, kg (lbs)
Ws =
beginning animal weight, kg (lbs)
W =
current animal weight, kg (lbs)
EFi = fan efficiency factor as determined by dirty versus cleaned
fan data
=
1.0 for cleaned fan
= a factor determined by the
difference in airflow delivery for a dirty versus cleaned fan