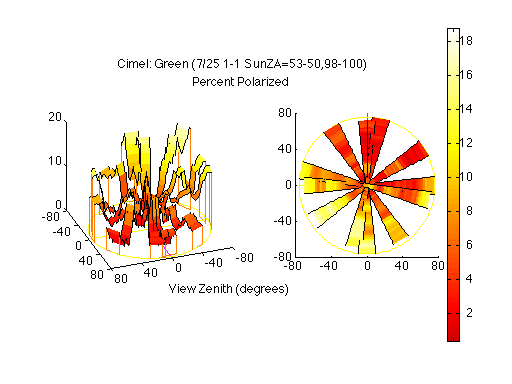
3D Plot of Percent Polarization
The left plot in the figure is a cylindrical plot of the percent polarization collected on July 25, 1991 for set 1 and replication 1. The radius of the cylinder represents view zenith angle, theta represents the relative view azimuth angle and the height represents percent polarization. The purple azimuth line represents a relative view azimuth of 0 degrees.
The right plot is a polar plot of same data that is in the cylindrical plot. The colors in both plots are related to the percent polarization according to the scale to the right side of the figure.
These data are for the Cimel green band. The width of the strips in the figures are related to the width of the FOV of the Cimel, i.e. 12 degrees.
