![]()
![]()
The purpose of the chapter is to present a basis for spectral
classifiers and discuss the parameters needed for the classifiers. Some of the
material comes from current literature1,2 and a book under development.3
Multispectral Data in Feature Space. The concept of looking at multispectral data in three different spaces will be presented – image, spectral and feature. Data presented in image space is useful to locate geographically where a pixel is from. Data presented in spectral space is useful in relating a given pixel’s response to the physical basis for that response. Feature space is useful to represent all of the diagnostic information mathematically for computation but not possible graphically for human view.
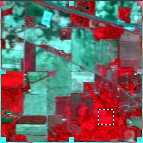
Data in Image Space
 \
\
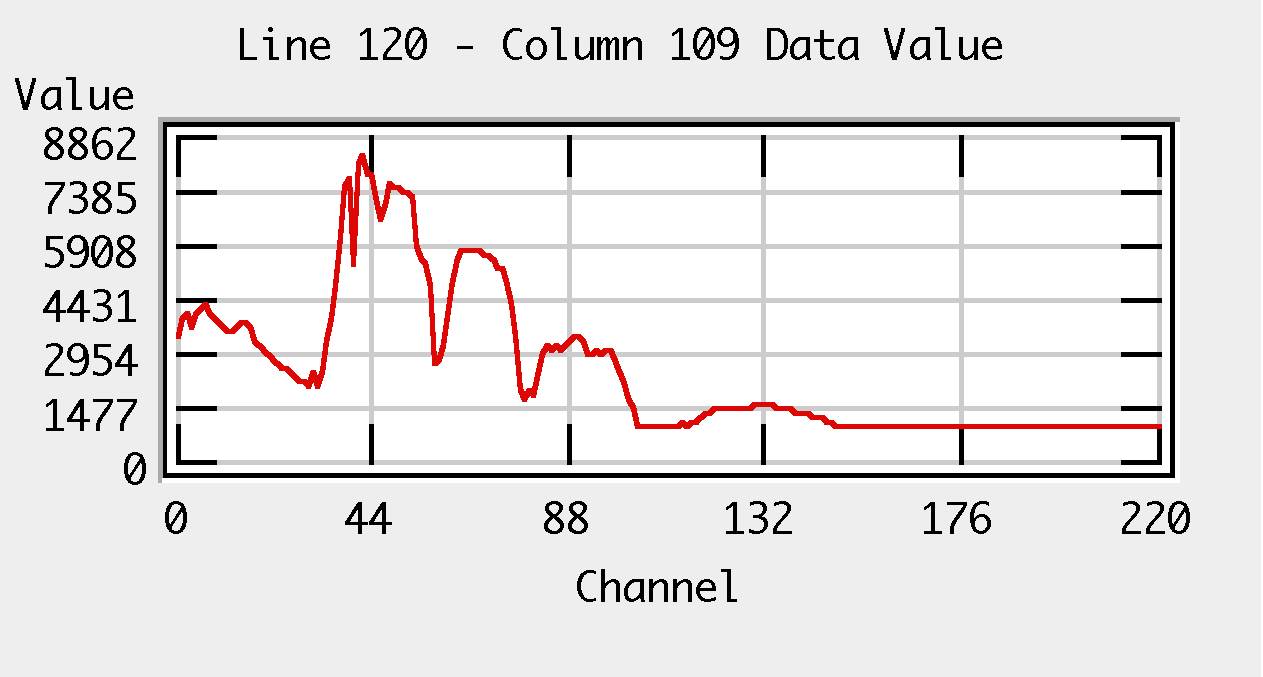
Data in Spectral Space
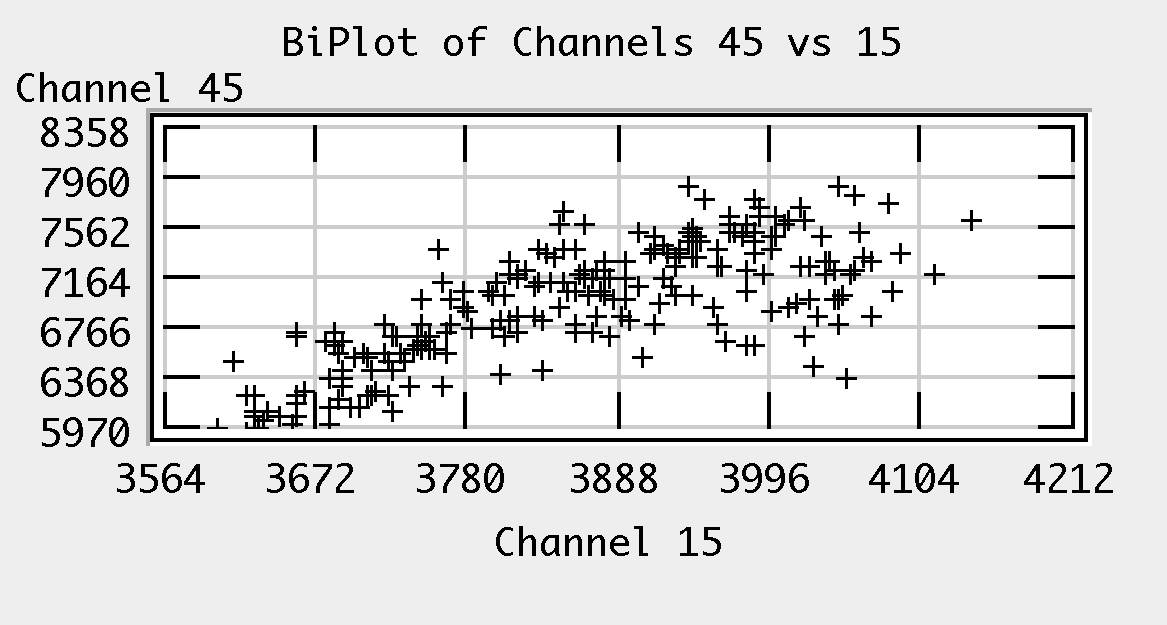
Data in Feature Space
Statistics Estimation in Multispectral Analysis. The analyses of multispectral
data is really a modeling exercise that is very much dependant upon the user’s
purpose for the analysis. For example, the data can be modeled with images (image
space), linear/nonlinear spectral mixing functions (spectral space) and Gaussian
density functions (feature space). Each of the models requires different types
of statistics including histograms, class means, and/or class covariances (2nd
order statistics).
Statistics Enhancement. As the dimension of the data becomes higher and
higher, the ability to find enough samples to make good estimates of some of
the statistics like the covariance matrix needed for some of the model approaches
listed above becomes very difficult. A method is presented that uses unlabeled
samples that can improve the estimated statistics.
From Level Slicer to Quadratic Classifiers. An overall view of several spectral
classifiers will be presented including Level Slicer, Parallelpiped, Correlation
(also called Spectral Angle Mapper), matched filters such as Constrained Energy
Minimization (CEM), Minimum Distance, Elliptical, Fisher Linear Discriminant
and Quadratic Maximum Likelihood Classifiers.
Visuals: Illustration of relationship of spectral mixing models and 1st
and 2nd order statistics; Illustration that the Maximum Likelihood Classifier
represents an entire family of classifiers from minimum distance to quadratic
only differing by the estimate used for the class covariance matrix. Illustration
of how the unlabeled samples are used to improved the class statistics.
Exercises and/or Assignments
Classifications with Different Classifiers
References: