

Review this document.
Find and review a journal article that describes the development of a simulation and its application. Provide a brief written review (due Mon Dec 1).
Simulation is a tool that has been commonly used to assist with systems analysis. Simulation is still widely used and is often use in combination with other techniques that we have examined - including linear programming, expert systems, and neural networks.
In its broadest sense, computer simulation is the process of designing a mathematical-logical model of a real system and experimenting with this model on a computer. Thus simulation encompasses a model building process as well as the design and implementation of an appropriate experiment involving that model. These experiments or simulations, permit inferences to be drawn about systems:
Simulation modeling assumes that we can describe a system in terms acceptable to a computing system. In this regard, a key concept is that of a system state description. If a system can be characterized by a set of variables, with each combination of variable values representing a unique state or condition of the system, then manipulation of the variable values simulates movement of the system from state to state. A simulation experiment involves observing the dynamic behavior of a model by moving from state to state in accordance with well-defined operating rules designed into the model.
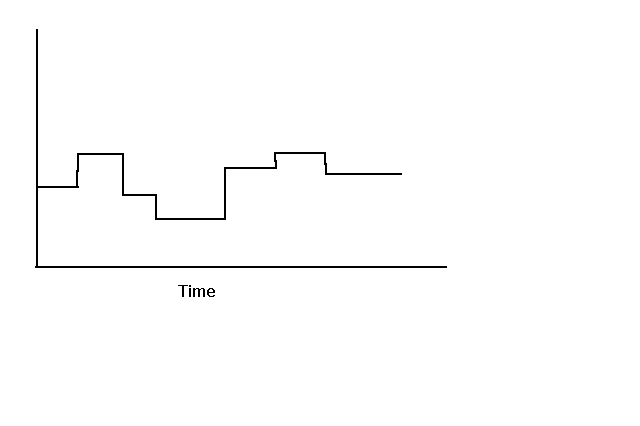
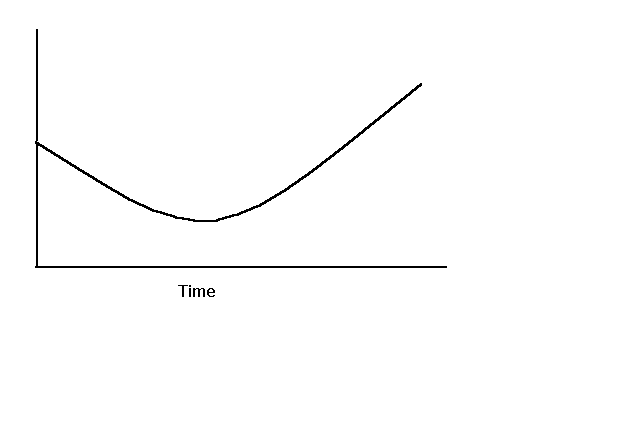
Changes in the state of a system can occur continuously over time or at discrete instants in time. The discrete instants can be established deterministically or stochastically depending on the nature of model inputs. Although the procedures for describing the dynamic behavior of discrete and continuous change models differ, the basic concept of simulating a system by portraying the changes in the state of the system over time remains the same.
Customer #     Time of Arrival    Service Time
                  (Minutes)         (Minutes)
    1                 3.2              3.8
    2                10.9              3.5
    3                13.2              4.2
    4                14.8              3.1
    5                17.7              2.4
    6                19.8              4.3
    7                21.5              2.7
    8                26.3              2.1
    9                32.1              2.5
   10                36.6              3.4
Since the simulation is the dynamic portrayal of the changes in the state of a system over time, the states of the system must be defined. For this example, they can be defined by the status of the teller (busy or idle) and by the number of customers at the bank. The state of the system is changed by a customer arriving to the bank, and the completion of service by the teller and subsequent departure of the customer. To illustrate a simulation, we will determine the state of the system over time by processing the events corresponding to the arrival and departure of customers in a time-ordered sequence.
The manual simulation of this example corresponding to the values in the above table is summarized in the table below by customer number. It is assumed that initially there are no customers in the system, the teller is idle, and the first customer is to arrive at time 3.2.
Customer  Arrival   Start   Departure   Time in   Time in
Number     Time    Service    Time       Queue      Bank
 (1)        (2)    Time (3)    (4)    (5)=(3)-(2) (6)=(4)-(2)

  1         3.2      3.2       7.0         0.0      3.8
  2        10.9     10.9      14.4         0.0      3.5
  3        13.2     14.4      18.6         1.2      5.4
  4        14.8     18.6      21.7         3.8      6.9
  5        17.7     21.7      24.1         4.0      6.4
  6        19.8     24.1      28.4         4.3      8.6
  7        21.5     28.4      31.1         6.9      9.6
  8        26.3     31.1      33.2         4.8      6.9
  9        32.1     33.2      35.7         1.1      3.6
 10        36.6     36.6      40.0         0.0      3.4
In the above table, columns (1) and (2) are taken from the first table. The start of service time given in column (3) depends on whether the preceding customer has departed the bank. It is taken as the larger value of the arrival time of the customer and the departure time of the previous customer. Column (4), the departure time, is the sum of the column (3) value and the service time for the customer given in the first table. Values for time in queue and time in bank for each customer are computed as shown in the above table. Average values per customer for these variables are 2.61 minutes and 5.81 minutes, respectively.
The above table presents a good summary of information concerning the customer but does not provide information about the teller and the queue size for the teller. To portray such information, it is convenient to examine the events associated with the situation.
The logic associated with processing the arrival and departure events depends on the state of the system at the time of the event. In the case of the arrival event, the disposition of the arriving customer is based on the status of the teller. If the teller is idle, the status of the teller is changed to busy and the departure event is scheduled for the customer by adding his service time to the current time. However, if the teller is busy at the time of an arrival, the customer cannot begin service at the current time and, therefore, he enters the queue (the queue length is increased by one). For the departure event, the logic associated with processing the event is based on queue length. If a customer is waiting in the queue, the teller status remains busy, the queue length is reduced by one, and the departure event for the first waiting customer is scheduled. However, if the queue is empty, the status of the teller is set to idle.
An event-oriented description of the bank teller status and the number of customers at the bank is given in the table below. The events are listed in chronological order. The results indicate that the average number of customers at the bank in the first 40 minutes is 1.4525 and that the teller is idle 20 percent of the time.
Event   Customer   Event   Number   Number   Teller   Teller
Time     Number     Type  in Queue  in Bank  Status  Idle Time

0.0                Start     0         0      Idle
3.2         1      Arrival   0         1      Busy      3.2
7.0         1      Departure 0         0      Idle
10.9        2      Arrival   0         1      Busy      3.9
13.2        3      Arrival   1         2      Busy
14.4        2      Departure 0         1      Busy
14.8        4      Arrival   1         2      Busy
17.7        5      Arrival   2         3      Busy
18.6        3      Departure 1         2      Busy
19.8        6      Arrival   2         3      Busy
21.5        7      Arrival   3         4      Busy
21.7        4      Departure 2         3      Busy
24.1        5      Departure 1         2      Busy
26.3        8      Arrival   2         3      Busy
28.4        6      Departure 1         2      Busy
31.1        7      Departure 0         1      Busy
32.1        9      Arrival   1         2      Busy
33.2        8      Departure 0         1      Busy
35.7        9      Departure 0         0      Idle
36.6       10      Arrival   0         1      Busy      0.9
40.0       10      Departure 0         0      Idle
To place the arrival and departure events in their proper chronological order, it is necessary to maintain a record calendar of future events to be processed. This is done by maintaining the times of the next arrival event and the next departure event. The next event to be processed is then selected by comparing these event times. For situations with many events, an ordered list of events would be maintained which is referred to as an event file or event calendar.
There are several important concepts illustrated by the above example. We observe that at any instant in simulated time, the model is in a particular state. As events occur, the state of the model may change as prescribed by the logical-mathematical relationships associated with the events. Thus, the events define the dynamic structure of the model. Given the starting state, the logic for processing each event, and a method for specifying sample values, our problem is largely one of bookkeeping. An essential element in our bookkeeping scheme is an event calendar which provides a mechanism for recording and sequencing future events. Another point is that we can view the state changes from two perspectives: the process that the customer encounters as he seeks service (the customer's view), or the events that caused the state of the teller to change (the teller's or bank's view).
Models are descriptions of systems. In the physical sciences, models are usually developed based on theoretical laws and principles. The usefulness of models has been demonstrated in describing, designing and analyzing systems. Model building is a complex task but can be made easier if:
The modeling of complex, large-scale systems is often mode difficult than the modeling of physical systems for the following reasons:
Simulation is often used at one of four levels:


Analytic solutions are available for some simple queueing situations. However, simulation models (queueing theory models) are necessary for solving most real-life problems. Queueing theory models have the advantage of providing almost unlimited detail in describing systems. Of course, developing and refining queueing theory models could be quite time consuming without the aid of special simulation computer languages.
Queues are generally governed by one of 4 rules that control the exit of entities in the queue:
Events are triggered by actions that happen to an entity. Occurrence of events is often used to collect statistics about an entity (e.g. time spent being serviced) and to schedule subsequent events.
A discrete simulation might be developed to model inventory levels which would be used to develop rules for managing the inventory. The objective is to minimize the inventory without penalizing sales. Using the simulation, rules can be developed for reorder, shipment time, and penalties for not satisfying the customer (lost sales).
In next-event scheduling, as each event is set up, it creates (schedules) the next procedure (event). Each event schedules the next event, allowing time to advance to the next scheduled event rather than advancing by some fixed time step. An event calendar is used to manage the scheduling of events. All events are scheduled and time at which they will occur is placed on the calendar. Next-event scheduling works well when one is not concerned about what happens outside of the system.
Entities are objects within a discrete simulation. Entities have attributes such as size, weight, time spent in the system thus far, color, etc. For example, an entity might represent a truck and attributes might include time of arrival to the system, weight of grain in the truck, and time to unload the grain.
Events refer to actions that are associated with entities. Events can be classified into 4 types: departing, arrivals, end of service (departure from service), and start of service.