Reasons for Modeling:
- Highlight problems of interest.
- Economical experimentation.
- Precision of thought.
- Solving operational problems.
- Impossible to analyze some systems mentally since
some systems are counterintuitive; mental models are
usually inexact.
- quantifies relationships and identifies gaps in our knowledge
(can be used to guide research)
- range of variables that can be examined in actual system
is often quite small in time and space scale
- dynamics of actual system may preclude data collection and observation
One of the initial steps in a modeling exercise is to organize the
elements of the system being studied in some fashion. Schematic models
provide a means of visualizing system structure and operation
without immediately trying to mathematically represent the system.
Such schematic models can reveal redundancies and system weaknesses
that can be corrected without extensive formal analysis. Understanding
a system well enough to construct a schematic model of its operation
may be the most important benefit of an operations engineering study.
There are many types of schematic models that might be used
by an operations engineer. The schematic models attempt to organize
knowledge in a logical fashion such that time, space and structural
relationships can be easily understood. Commonly used techniques
include:
- Organization charts
- Process Charts
- Activity Charts
- Logic Flow Charts
Organization Charts
Organization Charts - most activities require
some form of organization. The usual concept of an organization chart
is that of a series of blocks and lines showing the manner in which
individuals and functions are related to each other. They depict functional
responsibility and chain of command.
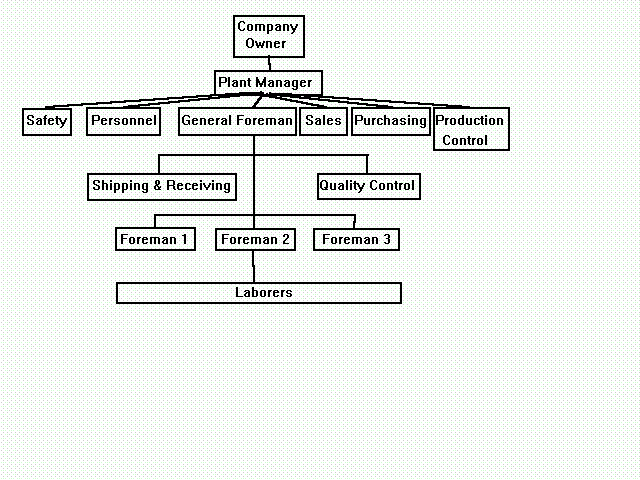
Organization charts provide snapshots of a company's structure
at one particular point in time. They are essentially a static
display of relationships.
An alternative to the functional type of organization is one which
is product oriented. In those cases each product line leads to
a separate structure. A quick glance at such charts establishes at
least formally the complete chain of command.
Unfortunately there is often considerable difference
between what many existing organization charts say about corporate
responsibility and authority and what actually occurs in daily operations.
For that reason, an analyst who is concerned with organizational problems would
do well to construct their own diagram depicting how decisions are
really made in the informal organization on the basis of personal observation.
In spite of its shortcomings, the organization chart can be a valuable tool
for both operations managers and engineers. Specific uses of the
organization chart include:
-
To show lines of direct authority and thereby serve as a quick
check on who is responsible for the various functions.
-
To illuminate organizational weaknesses such as more than one
person being assigned the same work or certain work being assigned to no one.
-
To serve as a training device and guide in planning for expansion.
-
To alert the public about work relationships within the company.
-
To remind employees about who supervises them.
Process charts provide a graphical representation of movement
through a process. They are most commonly used to chart the
movement of material through a manufacturing process but
can easily be adapted to chart the activities of a human operator
or the flow of information in a system. It is considered good practice
to limit each chart to one class of movement, e.g. do not
mix materials and people on the same chart. Standard symbols
are often used in process charts.