Pre-lab
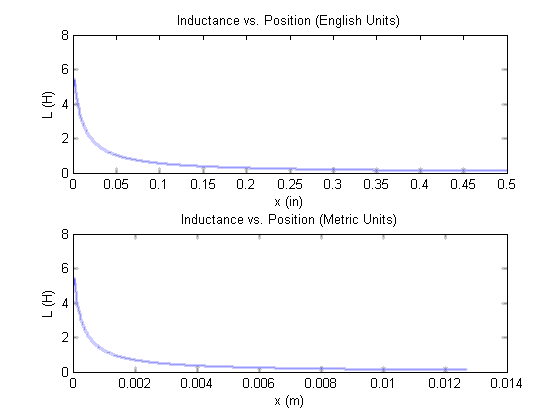
Reading Sections First edition Second edition 1.2 1.3 1.4 1.5 1.7 1.7 - Your inductance versus position plots should look like this.
- To find an equation for di/dt, start with the voltage equation for a solinoid v = ri+dλ/dt.
In-lab
Part a:
- The lab manual ask you to build two separate models. You can save some time by making one model that does the job of both.
- Remember to set the configuration parameters for every model you make. (Look back at lab one if you've forgot how.) However, xpcexplr only needs to be setup once per user for the semester unless you switch stations.
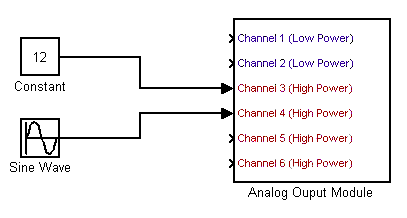
- Measure the applied voltage. It will be different from its model window value.
- see How To Measure A Signal
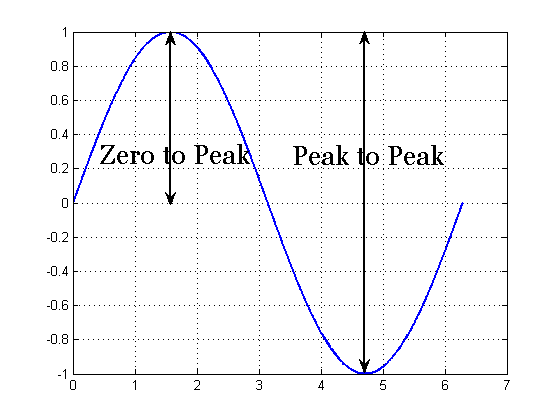
- Below is a 1-V zero to peak signal. Note that the amplitude is 1-V while the signal is 2-V peak to peak.
- see Shut Roll Mode Off
- see High Res Mode
- Find the x = 0" set screw position by energizing the solenoid with a dc constant (e.g. 12 V) and the set screw removed. Then gently turn the screw into the solenoid until it lightly contacts the plunger.
- You can change the frequency without stopping or rebuilding the model!
- When plotting in Matlab, use points for measured data, and lines for fitted data. For example:
plot(x,y_meas,'o',x,y_fitted) - Use an m-file to do the math (calculate impedance and inductance) for you. Its easier for you that way, just don't forget to turn in your code.
- One complete (360 degree) turn of the set screw advances x by 1/32".
Parts b and c:
- Convert position from inches to meters before plotting Inductance or calculating Ll, K, or ko.
- Note the single quote after the definition of vector a in the sample code. It means transpose and converts a from a row to a column vector. The vectors x, L_meas, and a must all be columns to use the function solenoid.m
- solenoid.m is provided for you.
- After running solinoid.m, a will contain fitted values for Ll, K, and ko. Record them in your lab notebook with the correct units.
Check your work.
- R ≈ 110 Ω
- L ≈ 6 H
- Ll ≈ 0.35 H
- K ≈ 0.0076 Hm
- ko ≈ 0.0015 m
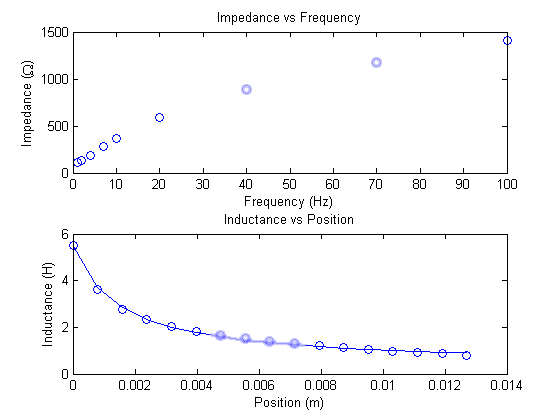
- Your plots should look like this.
Post-lab
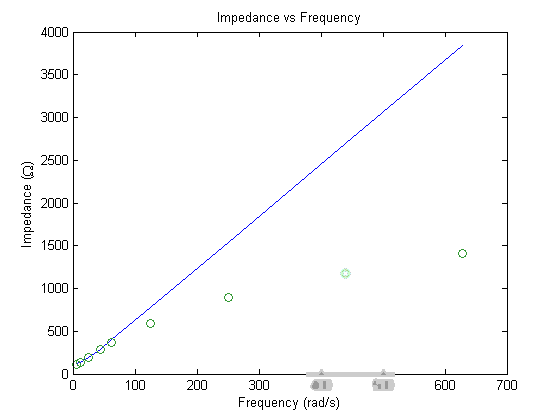
- For question 1, include a plot of |Z|ideal and |Z|measured on the same axis. Use Matlab and don't forget to submit your m-file for credit.
- For questions 2 through 6, use equations to support your answers.
- Question 6 has three parts. Be sure to answer each of them.