(2 points) Is the general level of the presentation in Chapter 3 too simple, too difficult, or about right for you?
(3
points) Which sections were the most helpful in understanding the material?
Which sections were confusing or otherwise inadequate? Which concepts need to be
presented better?
2. Poisson calculations.
The SR361 bridge across the Mythaca River between Middleville and
Shoridan is a toll facility.
The table below shows the SEB bridge volume counts by 20-minute periods
for a recent weekday morning.
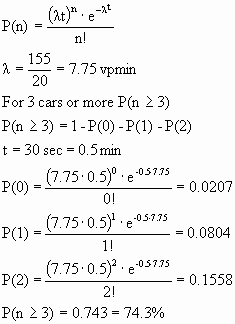
A. (10 points) If the arrivals between 7:20 AM and 7:40 AM are assumed to follow a Poisson Distribution, what is the probability that three or more vehicles will arrive during any given 30-second period?
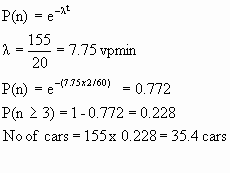
B. (10 points) If the vehicle arrivals in Part A (7:20-7:40 AM) follow a Poisson Distribution, how many of the 155 arrivals will approach the toll plaza less than two seconds after the previous vehicle? Note: The vehicles may be approaching in different lanes, but consider the multiple lanes as one approach.
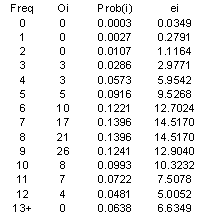
3. Goodness-of-fit. The flow data for each 20-second period in CNotes Table 2.5 were expressed in vehicles per hour. Is a Poisson model justified here? Convert these flow rates to vehicle counts for each 20-second period and ...
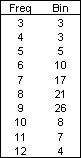
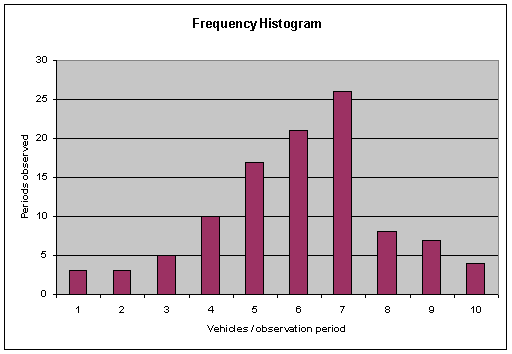
A. (10 points) Create a frequency histogram for Number of vehicle arrivals each 20-second interval.
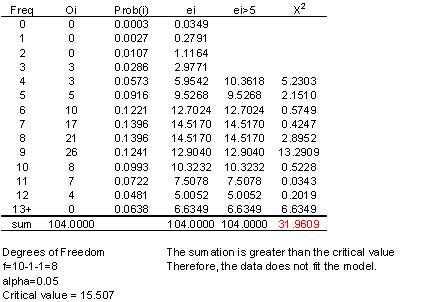
B. (10 points) Build a table like CNotes Table 3.5, but leave column 5 empty for now. Is the e(i)>5 criterion met? If not, combine adjacent rows in your table until the criterion is met. Show clearly which original rows have been combined. At this point, are there still at least 5 rows in the table?
ei>5 criterion is not met, therefore combine rows to meet requirement. If you add ei for frequencies 0 to 4, then you meet the requirement
C. (10 points) Fill in column 5 and the rest of the table with the combined rows, viz., f=k-1, alpha=0.05, and the critical value C(1-alpha,f) from CNotes Table 3.4. Can the observed O(i) frequencies be represented by a Poisson model?
4. Left Turn Lane Analysis using Queueing Equations.
The intersection of Coliseum Avenue and Wildcat Street near Mythaca State University has a signal with a
60-second cycle length.
At the start of each cycle, a "protected left turn phase" is provided for EB traffic on Coliseum that is
turning left onto NB Wildcat.
This left turn (LT) phase is long enough to allow only 6 vehicles to turn left.
Two conditions prevent an easy solution at the intersection:
(a) Traffic near the university fluctuates during each hour, depending on the times at which classes begin or end.
Between 15 and 25 minutes past each hour on MWF, an average of 8.9 drivers per minute try to enter the LT lane.
During the rest of the hour, an average of 3.1 drivers per minute want to turn left.
(b) Other approach volumes are too large to permit additional time to be given to the left turns made from the
EB approach.
The county staff thinks that the LT traffic at Coliseum Avenue and Wildcat Street are part of an
M/D/1 queueing regime.
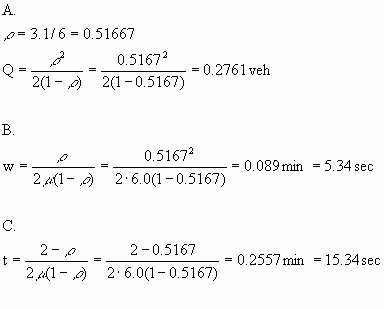
Assuming they are correct, show how to carry out the following calculations for the off-peak arrival rates:
60 sec cycle length
6 veh/cycle
m1 = 8.9 vpmin = 534 vph
m2 = 3.1 vpmin = 186 vph
l = 6 veh/cycle * 60 cycles/hr = 360 vph = 6 vpmin
A.(5
points) Average length of the LT queue
B.(5 points) Average waiting time in the LT queue
C.(5 points) Average time spent in the system
5. Left Turn Lane Analysis using Queueing Diagrams.
Starting at 15 minutes past the hour,
draw clearly a queueing diagram that shows the build-up and dissipation of the LT queue for the previous problem.
A. (15 points) Label the key elements in the queueing diagram. Use CNotes Figure 3.21 as a model, drawing the departure curve as a straight line with slope equal to service rate per signal cycle.
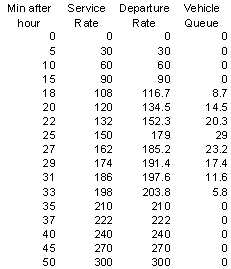
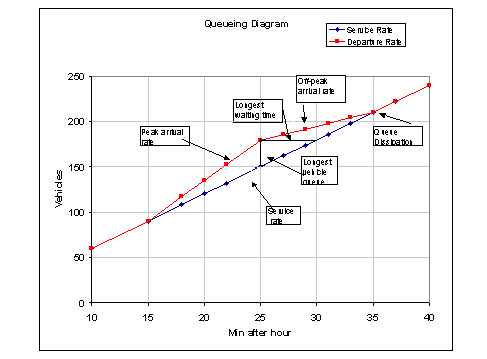
B. (15 points) Estimate the following values, showing the computations you use to support your estimates: (i) longest vehicle delay, (ii) longest vehicle queue, (iii) to the nearest minute, the time at which the LT queue will have dissipated.
(i) longest vehicle delay
The longest vehicle delay comes to the vehicle that arrives at 25 minutes past the hour when you have accumulated 89 vehicles after the 15 after 15 minutes after the hour.
LWT = 89/6 - 10 min = 4.83 min
(ii) longest vehicle queue
Vehicle queue=29 vehicles (see table above or excel file)
(iii) to the nearest minute, the time at which the LT queue will have dissipated.
It dissipates at 35 min past the hour.
If x corresponds to the minutes after :25 min
Service equation = 6x + 60
Arrival equation = 3.1x
6x + 60 = 89 + 3.1x when queue dissipates
2.9x = 29
x = 10 min after 25 min or at 35 min after the hour