clear all
disp(' '); disp('Start Here <<<<<<<<<<<<<<<<<<<<<<<<<<<<<<<<<<<<<<<')
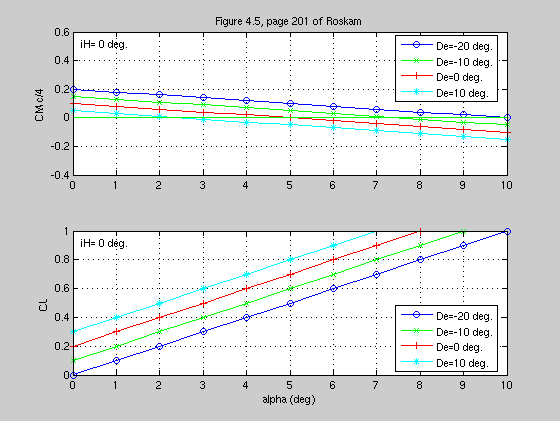
disp(' First we will duplicate figure 4.5 on page 201')
disp(' Data Input section')
CL0=.2
CLalpha=.1
CLdeltaE=.01
CLiH=3*CLdeltaE
CM0=.1
CMalpha=-.02
CMdeltaE=-.005
CMiH=3*CMdeltaE
deltaE=[-20 -10 0 10]
iH=0
mom_ref_pt=.25
forward_cg=.15
aft_cg=.30
alpha_stall=10
Cl_PlotMax=1.2
alpha_PlotMax=10
color=['-bo-gx-r+-c*-md-yv-k^'];
s1=['De=',num2str(deltaE(1)),' deg.'];
s2=['De=',num2str(deltaE(2)),' deg.'];
s3=['De=',num2str(deltaE(3)),' deg.'];
s4=['De=',num2str(deltaE(4)),' deg.'];
alpha=0:1:alpha_PlotMax;
dCMdCL=CMalpha/CLalpha;
CM0bar=CM0-dCMdCL*CL0;
CMiHbar=CMiH-dCMdCL*CLiH;
CMdeltaEbar=CMdeltaE-dCMdCL*CLdeltaE;
figure(1)
clf
for i=1:length(deltaE)
dE=deltaE(i);
CM=CM0+CMalpha*alpha+CMiH*iH+CMdeltaE*dE;
CL=CL0+CLalpha*alpha+CLiH*iH+CLdeltaE*dE;
subplot(211);plot(alpha,CM,color(3*(i-1)+1:3*(i-1)+3)); hold on
subplot(212);plot(alpha,CL,color(3*(i-1)+1:3*(i-1)+3)); hold on
end
LOC='NorthEast';
subplot(211); legend(s1,s2,s3,s4,'Location',LOC)
LOC='SouthEast';
subplot(212); legend(s1,s2,s3,s4,'Location',LOC)
subplot(211);plot(alpha,0*alpha,'g')
hold off
subplot(211);z1=axis;axis([z1(1) z1(2) -.4 .6]); grid on
ylabel('CM c/4')
title('Figure 4.5, page 201 of Roskam')
text2(.02,.92,['iH= ',num2str(iH),' deg.'])
subplot(212);z2=axis;axis([z2(1) z2(2) 0 1]); grid on
ylabel('CL')
xlabel('alpha (deg)')
text2(.02,.92,['iH= ',num2str(iH),' deg.'])
hold off
Start Here <<<<<<<<<<<<<<<<<<<<<<<<<<<<<<<<<<<<<<<
 First we will duplicate figure 4.5 on page 201
 Data Input section
CL0 =
          0.2
CLalpha =
          0.1
CLdeltaE =
         0.01
CLiH =
         0.03
CM0 =
          0.1
CMalpha =
        -0.02
CMdeltaE =
       -0.005
CMiH =
       -0.015
deltaE =
   -20   -10     0    10
iH =
     0
mom_ref_pt =
         0.25
forward_cg =
         0.15
aft_cg =
          0.3
alpha_stall =
    10
Cl_PlotMax =
          1.2
alpha_PlotMax =
    10
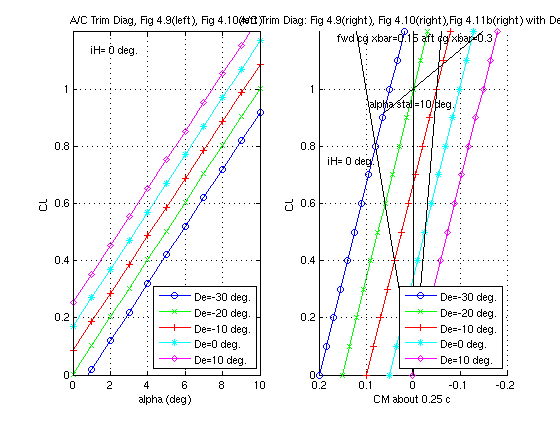
disp(' '); disp(' Second we will duplicate figures 4.9, 4.10, and 4.11(right)')
CL0=.17
CLalpha=.1
CLdeltaE=.25/30
CLiH=3*CLdeltaE
CM0=.025
CMalpha=-.015
CMdeltaE=-.0062
CMiH=3*CMdeltaE
iH=0
mom_ref_pt=.25
forward_cg=.15
aft_cg=.30
alpha_stall=10
Cl_PlotMax=1.2
alpha_PlotMax=10
deltaE=[-30 -20 -10 0 10]
color=['-bo-gx-r+-c*-md-yv-k^'];
s1=['De=',num2str(deltaE(1)),' deg.'];
s2=['De=',num2str(deltaE(2)),' deg.'];
s3=['De=',num2str(deltaE(3)),' deg.'];
s4=['De=',num2str(deltaE(4)),' deg.'];
s5=['De=',num2str(deltaE(5)),' deg.'];
alpha=0:1:alpha_PlotMax;
dCMdCL=CMalpha/CLalpha;
CM0bar=CM0-dCMdCL*CL0;
CMiHbar=CMiH-dCMdCL*CLiH;
CMdeltaEbar=CMdeltaE-dCMdCL*CLdeltaE;
figure(2)
clf
for i=1:length(deltaE)
dE=deltaE(i);
CL=CL0+CLalpha*alpha+CLiH*iH+CLdeltaE*dE;
CM=CM0bar+dCMdCL*CL+CMiHbar*iH+CMdeltaEbar*dE;
subplot(122);plot(CM,CL); hold on
subplot(121);plot(alpha,CL); hold on
end
subplot(122); z1=axis;
clf
CLexpended=z1(3):.1:z1(4);
for i=1:length(deltaE)
dE=deltaE(i);
CL=CL0+CLalpha*alpha+CLiH*iH+CLdeltaE*dE;
subplot(121);plot(alpha,CL,color(3*(i-1)+1:3*(i-1)+3)); hold on
CMexpanded=CM0bar+dCMdCL*CLexpended+CMiHbar*iH+CMdeltaEbar*dE;
subplot(122); hold on; plot(CMexpanded,CLexpended,color(3*(i-1)+1:3*(i-1)+3));
end
LOC='SouthEast';
subplot(122); legend(s1,s2,s3,s4,s5,'Location',LOC)
subplot(121); legend(s1,s2,s3,s4,s5,'Location',LOC)
subplot(122);plot([0 0],[0 z1(4)],'k')
hold off
subplot(122);z1=axis;axis([z1(1) z1(2) 0 Cl_PlotMax])
delta_cg1=mom_ref_pt-forward_cg;;
Cm_forward=+Cl_PlotMax*delta_cg1;
subplot(122);hold on; plot([0 Cm_forward],[0 Cl_PlotMax],'k')
delta_cg2=mom_ref_pt-aft_cg;
Cm_aft=+Cl_PlotMax*delta_cg2;
subplot(122);hold on; plot([0 Cm_aft],[0 Cl_PlotMax],'k')
str1=['CM about ',num2str(mom_ref_pt),' c'];
xlabel(str1)
ylabel('CL')
title('A/C Trim Diag: Fig 4.9(right), Fig 4.10(right),Fig 4.11b(right) with De=-30')
grid on
text(.18,.75,['iH= ',num2str(iH),' deg.'])
strXF=['fwd cg xbar=',num2str(forward_cg)];
strXR=['aft cg xbar=',num2str(aft_cg)];
text(.16,1.18,strXF)
text(-.02,1.18,strXR)
stralpha=['alpha stall=',num2str(alpha_stall), ' deg.'];
text(.09,.95,stralpha)
subplot(121);z2=axis; axis([z2(1) z2(2) 0 Cl_PlotMax]);
ylabel('CL')
xlabel('alpha (deg)')
title('A/C Trim Diag, Fig 4.9(left), Fig 4.10(left)')
grid on
text2(.1,.95,['iH= ',num2str(iH),' deg.'])
hold off
CL=CL0+CLalpha*alpha_stall+CLiH*iH+CLdeltaE*deltaE;
CM=CM0+CMalpha*alpha_stall+CMiH*iH+CMdeltaE*deltaE;
subplot(122); hold on; plot(CM,CL,'k');
axis([-.2 .2 0 1.2])
set(gca, 'XDir', 'reverse');
 Second we will duplicate figures 4.9, 4.10, and 4.11(right)
CL0 =
         0.17
CLalpha =
          0.1
CLdeltaE =
    0.0083333
CLiH =
        0.025
CM0 =
        0.025
CMalpha =
       -0.015
CMdeltaE =
      -0.0062
CMiH =
      -0.0186
iH =
     0
mom_ref_pt =
         0.25
forward_cg =
         0.15
aft_cg =
          0.3
alpha_stall =
    10
Cl_PlotMax =
          1.2
alpha_PlotMax =
    10
deltaE =
   -30   -20   -10     0    10