Representation of Normal Distribution with Mathematica
Normal distributions are everywhere! From grade curves to the hue variations of seed corn, from simple regression to design of experiments.Constructing and representing normal distribution should be a major tool for scientist. However, very few tools are readily available.
The purpose of this document is to present the use of Mathematica to represent normal distributions and some statistical tests. The code are the commands for using my Mathematica package ClassHelp.m
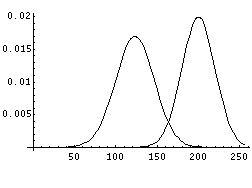
The familliar bell curve of the normal distribution of mean 123
and variance 23.5 is the following:
PlotN[123,23.5]

The representation of the distribution for a certain probability
is important to get a feel for the distribution in 1D, and is
also the best way to visualize a distribution in 2D and 3D.
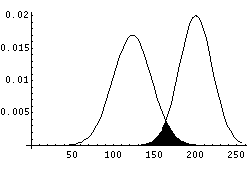
This graph represents the 90% probability interval for the 1D normal distribution
N(123,23.5).
PlotZ[123,23.5,0.9]

The 10% remaining are at the tail-end of the distribution.
