Lower Dimension Distributions
Color classifiers can use the three-dimensional data or dimensionally reduced data (2D and 1D). The following figure presents the uni-dimensional red distribution probabilities.
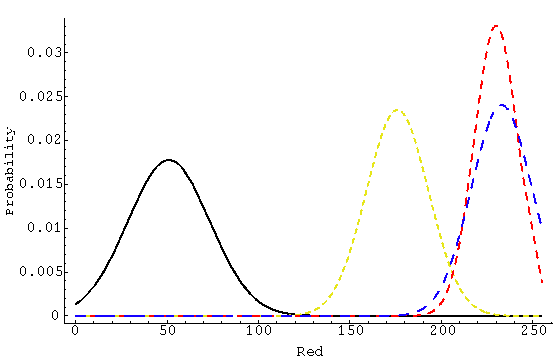
This plot is very useful for understanding the concept of thresholding. Selection of a threshold for segmenting color classes on the red band is made at the lowest point between distribution. In this case of the red band, background is easilly segmented by selecting a threshold of 105. However, the graph explains why the red band alone cannot be used for segmenting husk from corn (overlap of distribution).