3D Data Points Display
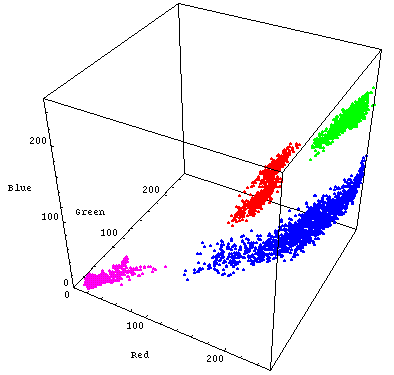
Display the data points in the three-dimensional color space gives the user a better understanding of the classification mechanisms. A Mathematica (tm) package was created to handle displays of points, distributions and classifiers.

In this graph background points are in purple, green husk points in red, white husk points in green, and corn in blue. An animation (~500Kb) of the 3D plot of a data base can be viewed. We have found that 3D data plots are quite difficult to understand for first timer. However, animation gives the impression of depth and facilitate comprehension.