Color Map for Display
Color images are commonly coded using 24 bits per pixel (8 bit for each color band). Other formats exist for specialized imagery, with more bits per pixels such as remote sensing or flat-bed scanners, or less bits for some color cameras.Computer displays are commonly 8-bit displays, whereas images are 24-bit. Allthought 24-bit screen exist their price is too high to be on every workstation.
On an 8-bit display there are 256 colors available at one time, which is insufficient to display all the 16 million colors possible in a 24-bit image. It is necessary to reduce the number of colors to the 256 available. This can be done without losing too much visual information because the human eye cannot distinguish that many colors at one time. You will be able to test this in the following document where images are displayed with varying number of colors.
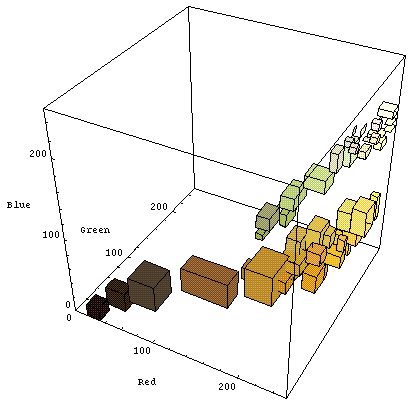
Reduction in the number of colors is done by regrouping colors in blocks. Each color in a block is assigned to the block's average color. The image is converted by changing a pixel value to its block's color. Thus before displaying the image the 256 colors are defined and every pixel has a displayable color.
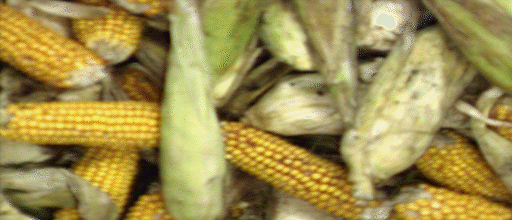
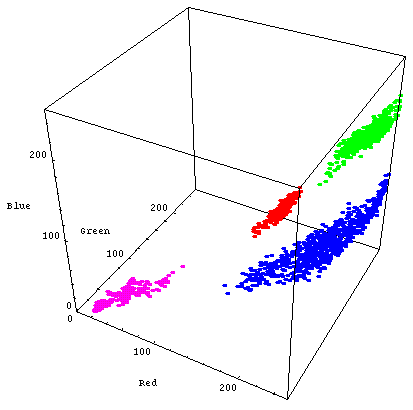
The following example illustrates the color map concept for the corn example image.

- Figure 1: Example corn image

- Figure 2: Colors for the corn image

- Figure 3: Colormap with 10 entries for the corn image

- Figure 4: Colormap with 50 entries for the corn image