| |
SCS Curve Number Method
The SCS curve number method is a simiple, widely used and efficient method for determining the approxient amount of runoff from a rainfall even in a particular area. Although the method is designed for a single storm event, it can be scaled to find average annual runoff values. The stat requirments for this method are very low, rainfall amount and curve number. The curve number is based on the area's hydrologic soil group, land use , treatment and hydrologic condition. The 2 former being of greatest importance.
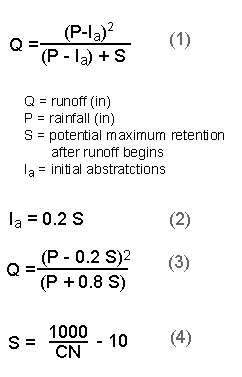
The general equation for the SCS curve number method is as follows:

The initial equation (1) is based on trends observed in data from collected sites, therefore it is an emperical equation instead of a physically based equation. After further empirical evaulation of the trends in the data base, the initial abstractions, Ia, could be defined as a percentage of S (2). With this assumption, the equation (3) could be written in a more simplified form with only 3 variables. The parameter CN is a transformation of S, and it is used to make interpolating, averaging, and weighting operations more linear (4).
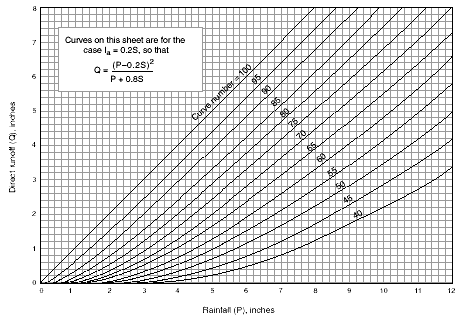
With the following chart, the amount of runoff can be found if the rainfall amount (in inches) and curve number is known.
There are two advantages of using L-THIA over a manual method. One, the availablity of the data. L-THIA provides the rainfall data for any area in the United States. Two, L-THIA completes this caluculation for every rainfall event for thirty years and then reports the average annual runoff value.

|
Land Use Description on Input Screen
|
Description and Curve Numbers
from TR-55
|
|||||
|
Cover Description
|
Curve Number for Hydrologic Soil Group | |||||
|
Cover Type and Hydrologic Condition
|
% Impervious Areas
|
A
|
B
|
C
|
D
|
|
| Agricultural | Row Crops - Staight Rows + Crop Residue Cover- Good Condition (1) |
|
64
|
75
|
82
|
85
|
| Commercial | Urban Districts: Commerical and Business |
85
|
89
|
92
|
94
|
95
|
| Forest | Woods(2) - Good Condition |
|
30
|
55
|
70
|
77
|
| Grass/Pasture | Pasture, Grassland, or Range(3) - Good Condition |
|
39
|
61
|
74
|
80
|
| High Density Residential | Residential districts by average lot size: 1/8 acre or less |
65
|
77
|
85
|
90
|
92
|
| Industrial | Urban district: Industrial |
72
|
81
|
88
|
91
|
93
|
| Low Density Residential | Residential districts by average lot size: 1/2 acre lot |
25
|
54
|
70
|
80
|
85
|
| Open Spaces | Open Space (lawns, parks, golf courses, cemeteries, etc.)(4) Fair Condition (grass cover 50% to 70%) |
|
49
|
69
|
79
|
84
|
| Parking and Paved Spaces | Impervious areas: Paved parking lots, roofs, drivesways, etc. (excluding right-of-way) |
100
|
98
|
98
|
98
|
98
|
| Residential 1/8 acre | Residential districts by average lot size: 1/8 acre or less |
65
|
77
|
85
|
90
|
92
|
| Residential 1/4 acre | Residential districts by average lot size: 1/4 acre |
38
|
61
|
75
|
83
|
87
|
| Residential 1/3 acre | Residential districts by average lot size: 1/3 acre |
30
|
57
|
72
|
81
|
86
|
| Residential 1/2 acre | Residential districts by average lot size: 1/2 acre |
25
|
54
|
70
|
80
|
85
|
| Residential 1 acre | Residential districts by average lot size: 1 acre |
20
|
51
|
68
|
79
|
84
|
| Residential 2 acres | Residential districts by average lot size: 2 acre |
12
|
46
|
65
|
77
|
82
|
| Water/ Wetlands |
0
|
0
|
0
|
0
|
0
|
|
|
Basic Input Value
|
Detailed Input
Value
|
Basic and Detailed
Input Type Value
|
Notes
(1) Hydraulic condition is based on combination factors that affect infiltration and runoff, including (a) density and canopy of vegetative areas, (b) amount of year-round cover, (c) amount of grass or close-seeded legumes, (d) percent of residue on the land surface (good>=20%), and (e) degree of surface roughness.
(2) Good: Woods are protected form grazing, and litter and brush adequately cover the soil.
(3) Good: >75% ground cover and lightly or only occasionally grazed.
(4) CN's shown sre equivalent to those of pasture. Composite CN's may be computed for other combinations of open space cover type.