|
LaPorte County County Precipitation
 |
| Figure 5. Average monthly
precipitation at LaPorte and probable 5-year high and low. |
The average yearly precipitation at LaPorte (rain, snow, sleet,
and hail) is 42.7 inches. Precipitation is relatively constant
throughout the year, as shown in Figure 5. Average monthly precipitation
is a little more than 3 inches, but monthly highs and lows can
vary considerably. The bars show average monthly precipitation,
while the lines represent a ‘‘wet” and ‘‘dry’’ year, defined as
the probable wettest year in five, and the probabledriest year
in five.
The presence of Lake Michigan produces unique climatic conditions
in the northern part of LaPorte County, including warmer falls,
cooler springs, and higher humidity. Average snowfall reaches
70 inches in the “snowbelt” (Figure 6), twice that in other parts
of northern Indiana. Snowfall constitutes about 10% of total precipitation,
but up to 19% in the snowbelt.
 |
| Figure 6. Mean annual snowfall
in LaPorte County in inches, showing lake effect. |
Individual storms can cause flooding, so precipitation records
over many years have been analyzed to assess the probability of
various storms occurring. Precipitation probability for a single
storm is generally expressed in terms of a return period, which
means the expected number of years between storms of a given size.
A “5-year storm” has a 20% chance of occurring in any one year,
so it is likely to occur about every 5 years on the average. However,
it is possible for a 5-year storm to occur many years in a row
or even several times in a single year. A 100-year storm has a
1% chance of occurring in any year. It is particularly important,
because the area that is expected to be flooded by the 100-year
storm is generally considered to be the “floodplain” mapped in
Figure 4. Before constructing any building in the area that will
be flooded by the 100-year storm, permission is required from
either the Indiana Department of Natural Resources, or from the
local Floodplain Management Agency, depending on which part of
the floodplain the building will be in.
 |
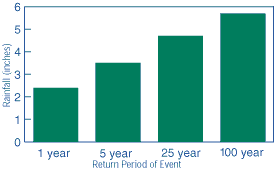
| Figure 7. Rainfall expected
in 24 hours for storm events of various probabilities. |
Figure 7 shows the expected 24-hour rainfall for LaPorte County
for various return periods.
|

