B.2 Probability and Statistics

Change of variables in probability densities

Distributions over linear combinations of random variables

  • •
    ​

    Have: px⁢y⁢o⁢(x,y,o)p_{xyo}(x,y,o)

  • •
    ​

    Define: Z . . =aX+bY{Z}\mathrel{\vbox{\hbox{.}\hbox{.} }}=a{X}+b{Y}

  • •
    ​

    Want: pz⁢op_{zo}

Let us use the change-of-variables formula to eliminate Y{Y} in favor of Z{Z}. We will therefore need (1) to express Y{Y} as a function of the other variables,

g(x,z) . . =(z−ax)/b,g(x,z)\mathrel{\vbox{\hbox{.}\hbox{.} }}=(z-ax)/b,

and (2) the derivative of this function with respect to its dependence on the variable we are introducing, Z{Z}:

∂g∂z⁢(x,z)=1/b.\frac{\partial{g}}{\partial{{\color[rgb]{.75,0,.25}\definecolor[named]{% pgfstrokecolor}{rgb}{.75,0,.25}z}}}(x,z)=1/b.

Then by the change-of-variables formula,

px⁢z⁢o⁢(x,z,o)=px⁢y⁢o⁢(x,g⁢(x,z),o)⁢|g⁢(x,z)|=px⁢y⁢o⁢(x,(z−a⁢x)/b,o)/|b|.p_{xzo}(x,z,o)=p_{xyo}(x,g(x,z),o)\mathopen{}\mathclose{{}\left\lvert g(x,z)}% \right\rvert=p_{xyo}(x,(z-ax)/b,o)/\mathopen{}\mathclose{{}\left\lvert b}% \right\rvert.

For the simple case of a=b=1a=b=1 (“coordinate transformation”), this reduces to

px⁢z⁢o⁢(x,z,o)=px⁢y⁢o⁢(x,(z−x),o).p_{xzo}(x,z,o)=p_{xyo}(x,(z-x),o).

Thus to get pz⁢op_{zo}, one substitutes (Z−X)({Z}-{X}) for Y{Y} in the original joint and integrates out X{X}.

The score function

The score is defined as the gradient of the log-likelihood (with respect to the parameters, 𝜽\bm{\theta}), dd⁢𝜽⁢log⁡p^⁢(𝒚;𝜽)\frac{\mathrm{d}{}}{\mathrm{d}{\bm{\theta}}}\log{\hat{p}\mathopen{}\mathclose{% {}\left(\bm{y}{};\bm{\theta}}\right)}. The mean of the score is zero:

𝔼𝒀⁢[dd⁢𝜽⁢log⁡p^⁢(𝒀;𝜽)]=∫𝒚p^⁢(𝒚;𝜽)⁢dd⁢𝜽⁢log⁡p^⁢(𝒚;𝜽)⁢d𝒚=∫𝒚p^⁢(𝒚;𝜽)⁢1p^⁢(𝒚;𝜽)⁢dd⁢𝜽⁢p^⁢(𝒚;𝜽)⁢d𝒚=∫𝒚dd⁢𝜽⁢p^⁢(𝒚;𝜽)⁢d𝒚=dd⁢𝜽⁢∫𝒚p^⁢(𝒚;𝜽)⁢d𝒚dd⁢𝜽⁢(1)=0.\begin{split}\mathbb{E}_{{\bm{Y}}{}}{\mathopen{}\mathclose{{}\left[{\frac{% \mathrm{d}{}}{\mathrm{d}{\bm{\theta}}}}\log{\hat{p}\mathopen{}\mathclose{{}% \left({\bm{Y}};\bm{\theta}}\right)}}\right]}&{}=\int_{\bm{y}{}}{\hat{p}% \mathopen{}\mathclose{{}\left(\bm{y};\bm{\theta}}\right)}{\frac{\mathrm{d}{}}{% \mathrm{d}{\bm{\theta}}}}\log{\hat{p}\mathopen{}\mathclose{{}\left(\bm{y};\bm{% \theta}}\right)}\mathop{}\!\mathrm{d}{\bm{y}{}}\\ &{}=\int_{\bm{y}{}}{\hat{p}\mathopen{}\mathclose{{}\left(\bm{y};\bm{\theta}}% \right)}\frac{1}{{\hat{p}\mathopen{}\mathclose{{}\left(\bm{y};\bm{\theta}}% \right)}}{\frac{\mathrm{d}{}}{\mathrm{d}{\bm{\theta}}}}{\hat{p}\mathopen{}% \mathclose{{}\left(\bm{y};\bm{\theta}}\right)}\mathop{}\!\mathrm{d}{\bm{y}{}}% \\ &{}=\int_{\bm{y}{}}{\frac{\mathrm{d}{}}{\mathrm{d}{\bm{\theta}}}}{\hat{p}% \mathopen{}\mathclose{{}\left(\bm{y};\bm{\theta}}\right)}\mathop{}\!\mathrm{d}% {\bm{y}{}}\\ &{}={\frac{\mathrm{d}{}}{\mathrm{d}{\bm{\theta}}}}\int_{\bm{y}{}}{\hat{p}% \mathopen{}\mathclose{{}\left(\bm{y};\bm{\theta}}\right)}\mathop{}\!\mathrm{d}% {\bm{y}{}}\\ &{}{\frac{\mathrm{d}{}}{\mathrm{d}{\bm{\theta}}}}(1)\\ &{}=0.\end{split}

The variance of the score is known as the Fisher information. Because its mean is zero, it is also the expected square of the score.

The Fisher information for exponential-family random variables

This turns out to take a simple form. For a (vector) random variable 𝒀{\bm{Y}} and “parameters” 𝜽\bm{\theta} (that may themselves be random variables):

p⁢(𝒚|𝜽)=p⁢(𝒚|𝜼)=h⁢(𝒚)⁢exp⁡{𝜼⁢(𝜽)T⁢𝑻⁢(𝒚)−A⁢(𝜼⁢(𝜽))},p({\color[rgb]{.75,0,.25}\definecolor[named]{pgfstrokecolor}{rgb}{.75,0,.25}% \bm{y}}|\bm{\theta})=p({\color[rgb]{.75,0,.25}\definecolor[named]{% pgfstrokecolor}{rgb}{.75,0,.25}\bm{y}}|\bm{\eta})=h({\color[rgb]{.75,0,.25}% \definecolor[named]{pgfstrokecolor}{rgb}{.75,0,.25}\bm{y}})\exp\bigg{\{}\bm{% \eta}(\bm{\theta})^{\text{T}}{\bm{T}}{}({\color[rgb]{.75,0,.25}\definecolor[% named]{pgfstrokecolor}{rgb}{.75,0,.25}\bm{y}})-A(\bm{\eta}(\bm{\theta}))\bigg{% \}},

the Fisher information is:

I⁢(𝜽)=−𝔼𝒀|𝜽[d2d⁢𝜽⁢d⁢𝜽Tlogp(𝒀|𝜽)|𝜽]=−𝔼𝒀|𝜽[d2d⁢𝜽⁢d⁢𝜽T[𝜼(𝜽)T𝑻(𝒀)−A(𝜼(𝜽))]|𝜽]=−𝔼𝒀|𝜽[∑id⁢ηi2d⁢𝜽⁢d⁢𝜽Tti(𝒀)−d⁢𝜼Td⁢𝜽d⁢A2d⁢𝜼⁢d⁢𝜼Td⁢𝜼d⁢𝜽T−∑id⁢ηi2d⁢𝜽⁢d⁢𝜽T∂A∂ηi|𝜽]=d⁢𝜼Td⁢𝜽Cov𝒀|𝜽[𝑻(𝒀)|𝜽]d⁢𝜼d⁢𝜽T,\begin{split}I(\bm{\theta})&{}=-\mathbb{E}_{{\bm{Y}}{}|\bm{\theta}}{\mathopen{% }\mathclose{{}\left[\frac{\mathrm{d}{}^{2}\!}{\mathrm{d}{\bm{\theta}}\mathrm{d% }{\bm{\theta}}^{\text{T}}}\log{p\mathopen{}\mathclose{{}\left({\bm{Y}}\middle|% \bm{\theta}}\right)}\middle|\bm{\theta}{}}\right]}\\ &{}=-\mathbb{E}_{{\bm{Y}}{}|\bm{\theta}}{\mathopen{}\mathclose{{}\left[\frac{% \mathrm{d}{}^{2}\!}{\mathrm{d}{\bm{\theta}}\mathrm{d}{\bm{\theta}}^{\text{T}}}% \mathopen{}\mathclose{{}\left[\bm{\eta}(\bm{\theta})^{\text{T}}{\bm{T}}{}({\bm% {Y}})-A(\bm{\eta}(\bm{\theta}))}\right]\middle|\bm{\theta}{}}\right]}\\ &{}=-\mathbb{E}_{{\bm{Y}}{}|\bm{\theta}}{\mathopen{}\mathclose{{}\left[\sum_{i% }\frac{\mathrm{d}{}^{2}\!\eta_{i}}{\mathrm{d}{\bm{\theta}}\mathrm{d}{\bm{% \theta}}^{\text{T}}}t_{i}({\bm{Y}})-\frac{\mathrm{d}{\bm{\eta}}^{\text{T}}}{% \mathrm{d}{\bm{\theta}}}\frac{\mathrm{d}{}^{2}\!A}{\mathrm{d}{\bm{\eta}}% \mathrm{d}{\bm{\eta}}^{\text{T}}}\frac{\mathrm{d}{\bm{\eta}}}{\mathrm{d}{\bm{% \theta}}^{\text{T}}}-\sum_{i}\frac{\mathrm{d}{}^{2}\!\eta_{i}}{\mathrm{d}{\bm{% \theta}}\mathrm{d}{\bm{\theta}}^{\text{T}}}\frac{\partial{A}}{\partial{{\color% [rgb]{.75,0,.25}\definecolor[named]{pgfstrokecolor}{rgb}{.75,0,.25}\eta_{i}}}}% \middle|\bm{\theta}{}}\right]}\\ &{}=\frac{\mathrm{d}{\bm{\eta}}^{\text{T}}}{\mathrm{d}{\bm{\theta}}}\text{Cov}% _{{\bm{Y}}{}|\bm{\theta}}{\mathopen{}\mathclose{{}\left[{\bm{T}}{}({\bm{Y}})% \middle|\bm{\theta}{}}\right]}\frac{\mathrm{d}{\bm{\eta}}}{\mathrm{d}{\bm{% \theta}}^{\text{T}}},\end{split}

where in the last line we have used the fact that the derivatives of the log-normalizer are the cumulants of the sufficient statistics (𝑻{\bm{T}}{}) under the distribution. A perhaps more interesting equivalent can be derived by noting that:

dd⁢𝜽𝔼𝒀|𝜽[𝑻(𝒀)|𝜽]=dd⁢𝜽d⁢Ad⁢𝜼T=d⁢A2d⁢𝜼⁢d⁢𝜼Td⁢𝜼d⁢𝜽T=Cov𝒀|𝜽[𝑻(𝒀)|𝜽]d⁢𝜼d⁢𝜽T.\frac{\mathrm{d}{}}{\mathrm{d}{\bm{\theta}}}\mathbb{E}_{{\bm{Y}}{}|\bm{\theta}% }{\mathopen{}\mathclose{{}\left[{\bm{T}}{}({\bm{Y}})\middle|\bm{\theta}{}}% \right]}=\frac{\mathrm{d}{}}{\mathrm{d}{\bm{\theta}}}\frac{\mathrm{d}{A}}{% \mathrm{d}{\bm{\eta}}^{\text{T}}}=\frac{\mathrm{d}{}^{2}\!A}{\mathrm{d}{\bm{% \eta}}\mathrm{d}{\bm{\eta}}^{\text{T}}}\frac{\mathrm{d}{\bm{\eta}}}{\mathrm{d}% {\bm{\theta}}^{\text{T}}}=\text{Cov}_{{\bm{Y}}{}|\bm{\theta}}{\mathopen{}% \mathclose{{}\left[{\bm{T}}{}({\bm{Y}})\middle|\bm{\theta}{}}\right]}\frac{% \mathrm{d}{\bm{\eta}}}{\mathrm{d}{\bm{\theta}}^{\text{T}}}.

Therefore, using the shorthand 𝝁 . . =𝔼𝒀|𝜽[𝑻(𝒀)|𝜽]\bm{\mu}\mathrel{\vbox{\hbox{.}\hbox{.} }}=\mathbb{E}_{{\bm{Y}}{}|\bm{\theta}}{\mathopen{}\mathclose{{}\left[{\bm{T}}{% }({\bm{Y}})\middle|\bm{\theta}{}}\right]}, we can write

equation (B.12) (B.12)
I⁢(𝜽)\displaystyle I(\bm{\theta})
=d⁢𝜼Td⁢𝜽⁢d⁢𝝁d⁢𝜽T\displaystyle{}=\frac{\mathrm{d}{\bm{\eta}}^{\text{T}}}{\mathrm{d}{\bm{\theta}% }}\frac{\mathrm{d}{\bm{\mu}}}{\mathrm{d}{\bm{\theta}}^{\text{T}}}
equation (B.13) (B.13)
=d⁢𝝁Td⁢𝜽Cov𝒀|𝜽[𝑻(𝒀)|𝜽]−1d⁢𝝁d⁢𝜽T\displaystyle{}=\frac{\mathrm{d}{\bm{\mu}}^{\text{T}}}{\mathrm{d}{\bm{\theta}}% }{\text{Cov}_{{\bm{Y}}{}|\bm{\theta}}{\mathopen{}\mathclose{{}\left[{\bm{T}}{}% ({\bm{Y}})\middle|\bm{\theta}{}}\right]}}^{-1}\frac{\mathrm{d}{\bm{\mu}}}{% \mathrm{d}{\bm{\theta}}^{\text{T}}}
equation (B.14) (B.14)
=d⁢𝜼Td⁢𝜽Cov𝒀|𝜽[𝑻(𝒀)|𝜽]d⁢𝜼d⁢𝜽T\displaystyle{}=\frac{\mathrm{d}{\bm{\eta}}^{\text{T}}}{\mathrm{d}{\bm{\theta}% }}\text{Cov}_{{\bm{Y}}{}|\bm{\theta}}{\mathopen{}\mathclose{{}\left[{\bm{T}}{}% ({\bm{Y}})\middle|\bm{\theta}{}}\right]}\frac{\mathrm{d}{\bm{\eta}}}{\mathrm{d% }{\bm{\theta}}^{\text{T}}}

Markov chains

Discrete random variables

[[[table]]]

Useful identities

Expectations of quadratic functions.

Consider a vector random variable 𝑿{\bm{X}} with mean 𝝁\bm{\mu} and covariance 𝚺\mathbf{{\Sigma}}. Expectations are generally intractable for arbitrary functions of 𝑿{\bm{X}}, but not low-order polynomials. In particular, expectations of first-order functions depend only on first-order expectations, i.e. the mean:

𝔼⁢[𝐌⁢𝑿+𝒎]=𝐌⁢𝔼⁢[𝑿]+𝒎=𝐌⁢𝝁+𝒎.\mathbb{E}{\mathopen{}\mathclose{{}\left[\mathbf{M}{\bm{X}}+\bm{m}}\right]}=% \mathbf{M}\mathbb{E}{\mathopen{}\mathclose{{}\left[{\bm{X}}}\right]}+\bm{m}=% \mathbf{M}\bm{\mu}+\bm{m}.

Similar, expectations of second-order functions depend on the first two moments. We can show this by exploiting the cyclic-permutation property of the matrix-trace operator, and the linearity of expectation and trace:

equation (B.15) (B.15)
𝔼⁢[𝑿T⁢𝐌⁢𝑿+𝒎T⁢𝑿+m]=𝔼⁢[tr⁢[𝑿T⁢𝐌⁢𝑿]]+𝒎T⁢𝔼⁢[𝑿]+m=𝔼⁢[tr⁢[𝐌⁢𝑿⁢𝑿T]]+𝒎T⁢𝔼⁢[𝑿]+m=tr⁢[𝐌⁢𝔼⁢[𝑿⁢𝑿T]]+𝒎T⁢𝔼⁢[𝑿]+m=tr⁢[𝐌⁢(Cov⁢[𝑿]+𝔼⁢[𝑿]⁢𝔼⁢[𝑿T])]+𝒎T⁢𝔼⁢[𝑿]+m=tr⁢[𝐌⁢Cov⁢[𝑿]]+𝔼⁢[𝑿T]⁢𝐌⁢𝔼⁢[𝑿]+𝒎T⁢𝔼⁢[𝑿]+m=tr⁢[𝐌⁢𝚺]+𝝁T⁢𝐌⁢𝝁+𝒎T⁢𝝁+m\begin{split}\mathbb{E}{\mathopen{}\mathclose{{}\left[{\bm{X}}^{\text{T}}% \mathbf{M}{\bm{X}}+\bm{m}^{\text{T}}{\bm{X}}+m}\right]}&{}=\mathbb{E}{% \mathopen{}\mathclose{{}\left[\text{tr}\mathopen{}\mathclose{{}\left[{\bm{X}}^% {\text{T}}\mathbf{M}{\bm{X}}}\right]}\right]}+\bm{m}^{\text{T}}\mathbb{E}{% \mathopen{}\mathclose{{}\left[{\bm{X}}}\right]}+m\\ &{}=\mathbb{E}{\mathopen{}\mathclose{{}\left[\text{tr}\mathopen{}\mathclose{{}% \left[\mathbf{M}{\bm{X}}{\bm{X}}^{\text{T}}}\right]}\right]}+\bm{m}^{\text{T}}% \mathbb{E}{\mathopen{}\mathclose{{}\left[{\bm{X}}}\right]}+m\\ &{}=\text{tr}\mathopen{}\mathclose{{}\left[\mathbf{M}\mathbb{E}{\mathopen{}% \mathclose{{}\left[{\bm{X}}{\bm{X}}^{\text{T}}}\right]}}\right]+\bm{m}^{\text{% T}}\mathbb{E}{\mathopen{}\mathclose{{}\left[{\bm{X}}}\right]}+m\\ &{}=\text{tr}\mathopen{}\mathclose{{}\left[\mathbf{M}\mathopen{}\mathclose{{}% \left(\text{Cov}{\mathopen{}\mathclose{{}\left[{\bm{X}}}\right]}+\mathbb{E}{% \mathopen{}\mathclose{{}\left[{\bm{X}}}\right]}\mathbb{E}{\mathopen{}% \mathclose{{}\left[{\bm{X}}^{\text{T}}}\right]}}\right)}\right]+\bm{m}^{\text{% T}}\mathbb{E}{\mathopen{}\mathclose{{}\left[{\bm{X}}}\right]}+m\\ &{}=\text{tr}\mathopen{}\mathclose{{}\left[\mathbf{M}\text{Cov}{\mathopen{}% \mathclose{{}\left[{\bm{X}}}\right]}}\right]+\mathbb{E}{\mathopen{}\mathclose{% {}\left[{\bm{X}}^{\text{T}}}\right]}\mathbf{M}\mathbb{E}{\mathopen{}\mathclose% {{}\left[{\bm{X}}}\right]}+\bm{m}^{\text{T}}\mathbb{E}{\mathopen{}\mathclose{{% }\left[{\bm{X}}}\right]}+m\\ &{}=\text{tr}\mathopen{}\mathclose{{}\left[\mathbf{M}\mathbf{{\Sigma}}}\right]% +\bm{\mu}^{\text{T}}\mathbf{M}\bm{\mu}+\bm{m}^{\text{T}}\bm{\mu}+m\\ \end{split}

We can think of this as simply replacing each occurrence of the random variable in the original polynomial with its mean, plus a correction term to account for the covariance.

One very common application of this identity is to quadratic functions that take the form (𝒃−𝐂⁢𝑿)T⁢𝐀⁢(𝒃−𝐂⁢𝑿)\mathopen{}\mathclose{{}\left(\bm{b}-\mathbf{{C}}{\bm{X}}}\right)^{\text{T}}% \mathbf{A}\mathopen{}\mathclose{{}\left(\bm{b}-\mathbf{{C}}{\bm{X}}}\right). This term can occur, for example, in the log probability of a Gaussian distribution about 𝐂⁢𝑿\mathbf{{C}}{\bm{X}}. Expanding this form to look like the polynomial in Eq. B.15, and then matching terms, we find

equation (B.16) (B.16)
𝔼⁢[(𝒃−𝐂⁢𝑿)T⁢𝐀⁢(𝒃−𝐂⁢𝑿)]=𝔼⁢[𝑿T⁢𝐂T⁢𝐀𝐂⁢𝑿+2⁢𝒃T⁢𝐀𝐂⁢𝑿+𝒃T⁢𝐀⁢𝒃]=tr⁢[𝐂T⁢𝐀𝐂⁢𝚺]+𝝁T⁢𝐂T⁢𝐀𝐂⁢𝝁+2⁢𝒃T⁢𝐀𝐂⁢𝝁+𝒃T⁢𝐀⁢𝒃=tr⁢[𝐂T⁢𝐀𝐂⁢𝚺]+(𝒃−𝐂⁢𝝁)T⁢𝐀⁢(𝒃−𝐂⁢𝝁).\begin{split}\mathbb{E}{\mathopen{}\mathclose{{}\left[\mathopen{}\mathclose{{}% \left(\bm{b}-\mathbf{{C}}{\bm{X}}}\right)^{\text{T}}\mathbf{A}\mathopen{}% \mathclose{{}\left(\bm{b}-\mathbf{{C}}{\bm{X}}}\right)}\right]}&{}=\mathbb{E}{% \mathopen{}\mathclose{{}\left[{\bm{X}}^{\text{T}}\mathbf{{C}}^{\text{T}}% \mathbf{A}\mathbf{{C}}{\bm{X}}+2\bm{b}^{\text{T}}\mathbf{A}\mathbf{{C}}{\bm{X}% }+\bm{b}^{\text{T}}\mathbf{A}\bm{b}}\right]}\\ &{}=\text{tr}\mathopen{}\mathclose{{}\left[\mathbf{{C}}^{\text{T}}\mathbf{A}% \mathbf{{C}}\mathbf{{\Sigma}}}\right]+\bm{\mu}^{\text{T}}\mathbf{{C}}^{\text{T% }}\mathbf{A}\mathbf{{C}}\bm{\mu}+2\bm{b}^{\text{T}}\mathbf{A}\mathbf{{C}}\bm{% \mu}+\bm{b}^{\text{T}}\mathbf{A}\bm{b}\\ &{}=\text{tr}\mathopen{}\mathclose{{}\left[\mathbf{{C}}^{\text{T}}\mathbf{A}% \mathbf{{C}}\mathbf{{\Sigma}}}\right]+\mathopen{}\mathclose{{}\left(\bm{b}-% \mathbf{{C}}\bm{\mu}}\right)^{\text{T}}\mathbf{A}\mathopen{}\mathclose{{}\left% (\bm{b}-\mathbf{{C}}\bm{\mu}}\right).\end{split}

Simulating Poisson random variates with mean less than 1.

motivation…

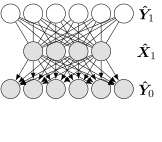
Consider the graphical model shown below. We want to show that the marginal probabilitity of Y^{\hat{Y}} is distributed as a Poisson random variable with mean μ\mu—as long as μ<1\mu<1.

The derivation at right shows this marginalization. The third line follows because the probability of Y^{\hat{Y}} (the number of “successes”) is zero for any Y^>X^{\hat{Y}}>{\hat{X}}, since X^{\hat{X}} is the number of Bernoulli trials (it is impossible to have more successes than trials).
p^⁢(y;𝜽)=∑x^=0∞p^(x^;𝜽)p^(y|x^;𝜽)=∑x^=0∞Pois⁢(x^;1)⁢Bino⁢(y;x^,μ)=∑x^=y∞Pois⁢(x^;1)⁢Bino⁢(y;x^,μ)=∑x^=y∞e−1x^!⁢(x^y)⁢μy⁢(1−μ)x^−y=∑x^=y∞e−1x^!⁢x^!y!⁢(x^−y)!⁢μy⁢(1−μ)x^−y=e−1⁢μyy!⁢∑x^=y∞1(x^−y)!⁢(1−μ)x^−y=e−1⁢μyy!⁢∑m=0∞1m!⁢(1−μ)m=e−1⁢μyy!⁢e1−μ=e−μ⁢μyy!=Pois⁢(μ)\begin{split}{\hat{p}\mathopen{}\mathclose{{}\left({\color[rgb]{.75,0,.25}% \definecolor[named]{pgfstrokecolor}{rgb}{.75,0,.25}y}{};\bm{\theta}}\right)}&{% }=\sum_{\hat{x}{}=0}^{\infty}{\hat{p}\mathopen{}\mathclose{{}\left(\hat{x};\bm% {\theta}}\right)}{\hat{p}\mathopen{}\mathclose{{}\left({\color[rgb]{.75,0,.25}% \definecolor[named]{pgfstrokecolor}{rgb}{.75,0,.25}y}{}\middle|\hat{x};\bm{% \theta}}\right)}\\ &{}=\sum_{\hat{x}{}=0}^{\infty}\text{Pois}\mathopen{}\mathclose{{}\left(\hat{x% };1}\right)\text{Bino}\mathopen{}\mathclose{{}\left({\color[rgb]{.75,0,.25}% \definecolor[named]{pgfstrokecolor}{rgb}{.75,0,.25}y}{};\hat{x},\mu}\right)\\ &{}=\sum_{\hat{x}{}={\color[rgb]{.75,0,.25}\definecolor[named]{pgfstrokecolor}% {rgb}{.75,0,.25}y}{}}^{\infty}\text{Pois}\mathopen{}\mathclose{{}\left(\hat{x}% ;1}\right)\text{Bino}\mathopen{}\mathclose{{}\left({\color[rgb]{.75,0,.25}% \definecolor[named]{pgfstrokecolor}{rgb}{.75,0,.25}y}{};\hat{x},\mu}\right)\\ &{}=\sum_{\hat{x}{}={\color[rgb]{.75,0,.25}\definecolor[named]{pgfstrokecolor}% {rgb}{.75,0,.25}y}{}}^{\infty}\frac{e^{-1}}{\hat{x}!}\binom{\hat{x}}{{\color[% rgb]{.75,0,.25}\definecolor[named]{pgfstrokecolor}{rgb}{.75,0,.25}y}{}}\mu^{{% \color[rgb]{.75,0,.25}\definecolor[named]{pgfstrokecolor}{rgb}{.75,0,.25}y}{}}% (1-\mu)^{\hat{x}-{\color[rgb]{.75,0,.25}\definecolor[named]{pgfstrokecolor}{% rgb}{.75,0,.25}y}{}}\\ &{}=\sum_{\hat{x}{}={\color[rgb]{.75,0,.25}\definecolor[named]{pgfstrokecolor}% {rgb}{.75,0,.25}y}{}}^{\infty}\frac{e^{-1}}{\hat{x}!}\frac{\hat{x}!}{{\color[% rgb]{.75,0,.25}\definecolor[named]{pgfstrokecolor}{rgb}{.75,0,.25}y}{}!(\hat{x% }-{\color[rgb]{.75,0,.25}\definecolor[named]{pgfstrokecolor}{rgb}{.75,0,.25}y}% {})!}\mu^{{\color[rgb]{.75,0,.25}\definecolor[named]{pgfstrokecolor}{rgb}{% .75,0,.25}y}{}}(1-\mu)^{\hat{x}-{\color[rgb]{.75,0,.25}\definecolor[named]{% pgfstrokecolor}{rgb}{.75,0,.25}y}{}}\\ &{}=\frac{e^{-1}\mu^{{\color[rgb]{.75,0,.25}\definecolor[named]{pgfstrokecolor% }{rgb}{.75,0,.25}y}{}}}{{\color[rgb]{.75,0,.25}\definecolor[named]{% pgfstrokecolor}{rgb}{.75,0,.25}y}{}!}\sum_{\hat{x}{}={\color[rgb]{.75,0,.25}% \definecolor[named]{pgfstrokecolor}{rgb}{.75,0,.25}y}{}}^{\infty}\frac{1}{(% \hat{x}-{\color[rgb]{.75,0,.25}\definecolor[named]{pgfstrokecolor}{rgb}{% .75,0,.25}y}{})!}(1-\mu)^{\hat{x}-{\color[rgb]{.75,0,.25}\definecolor[named]{% pgfstrokecolor}{rgb}{.75,0,.25}y}{}}\\ &{}=\frac{e^{-1}\mu^{{\color[rgb]{.75,0,.25}\definecolor[named]{pgfstrokecolor% }{rgb}{.75,0,.25}y}{}}}{{\color[rgb]{.75,0,.25}\definecolor[named]{% pgfstrokecolor}{rgb}{.75,0,.25}y}{}!}\sum_{m{}=0}^{\infty}\frac{1}{m!}(1-\mu)^% {m}\\ &{}=\frac{e^{-1}\mu^{{\color[rgb]{.75,0,.25}\definecolor[named]{pgfstrokecolor% }{rgb}{.75,0,.25}y}{}}}{{\color[rgb]{.75,0,.25}\definecolor[named]{% pgfstrokecolor}{rgb}{.75,0,.25}y}{}!}e^{1-\mu}=\frac{e^{-\mu}\mu^{{\color[rgb]% {.75,0,.25}\definecolor[named]{pgfstrokecolor}{rgb}{.75,0,.25}y}{}}}{{\color[% rgb]{.75,0,.25}\definecolor[named]{pgfstrokecolor}{rgb}{.75,0,.25}y}{}!}=\text% {Pois}\mathopen{}\mathclose{{}\left(\mu}\right)\end{split}