Diversity in Engineering
By the Numbers
These graphs reflect some commonly referenced and requested diversity-related information. Additional materials will be added as they become available with a large set of materials planned in Spring 2021. New academic year details are scheduled to be added each fall in late September. All figures exclude counts from Agricultural and Biological Engineering (ABE), which is a joint program between the College of Agriculture and College of Engineering. See https://www.purdue.edu/idata/Products/Data/SelfServiceReporting/index.php for underlying data tables. For specific questions or requests for new content, contact us at: deanofengineering@purdue.edu.
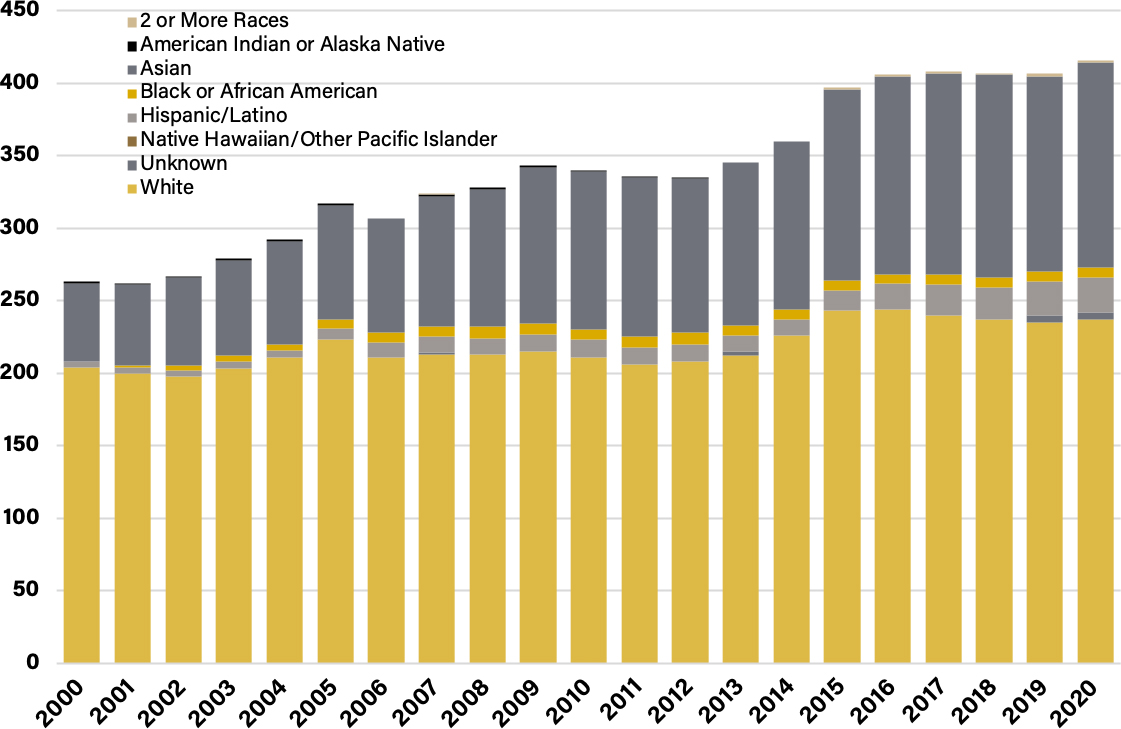
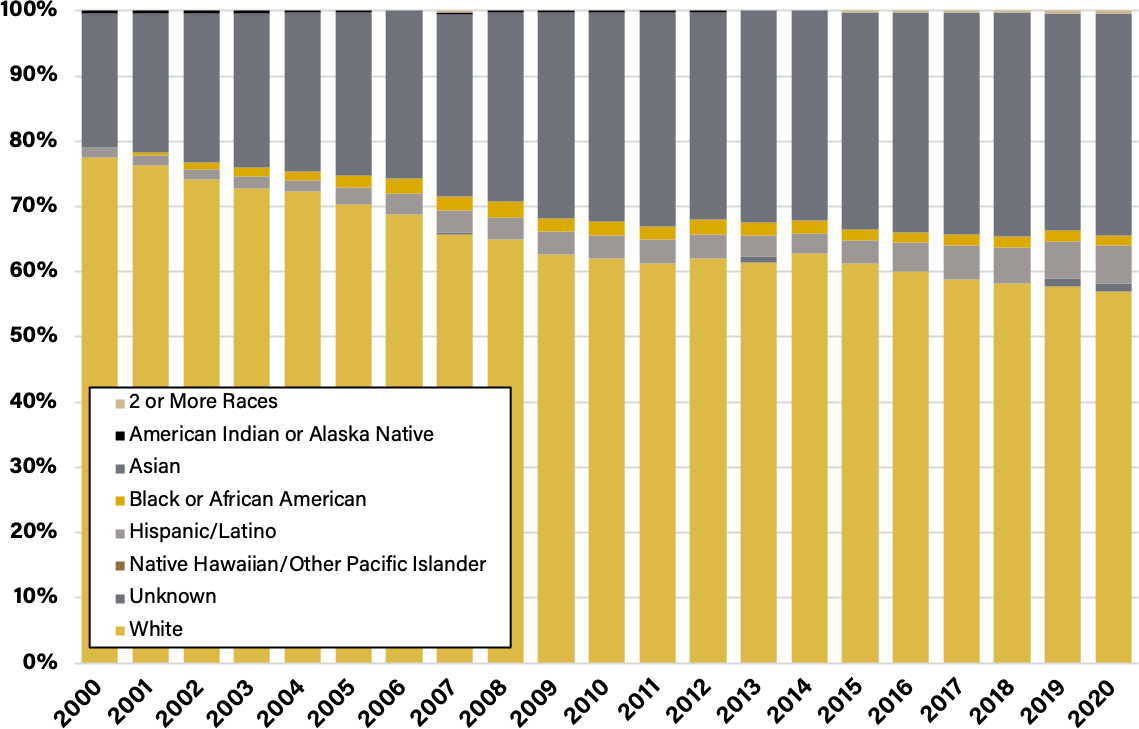
Race and ethnicity are self-reported by students and follow the IPEDS federal guidelines.
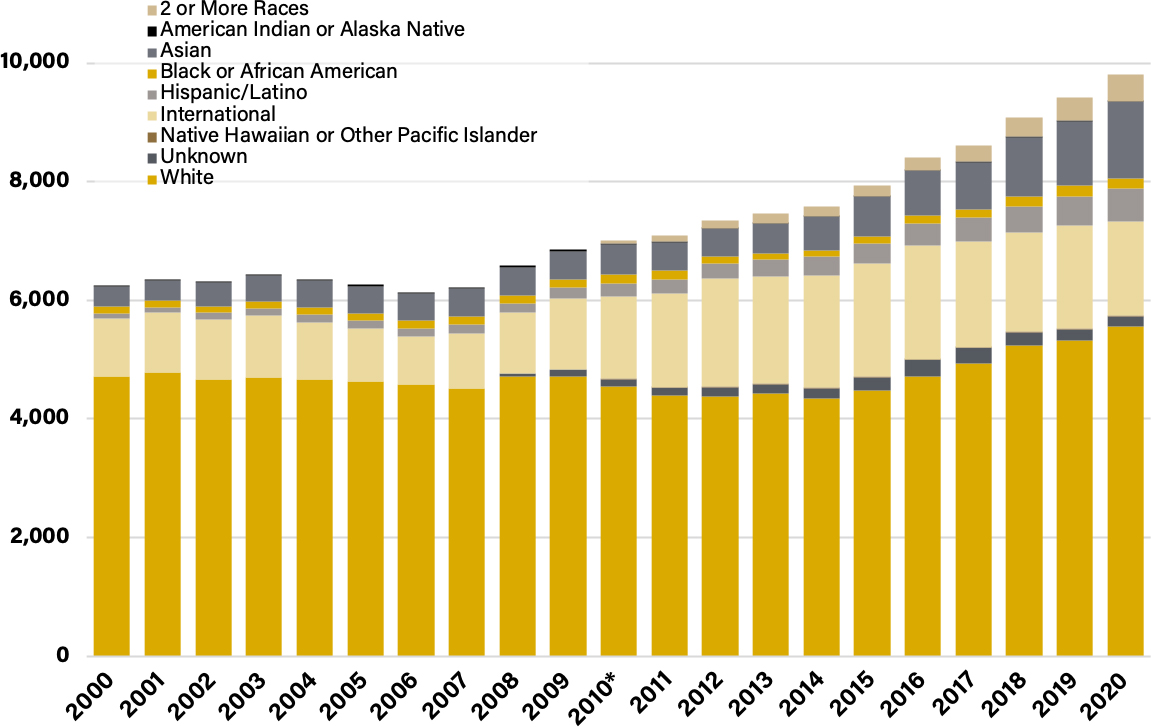
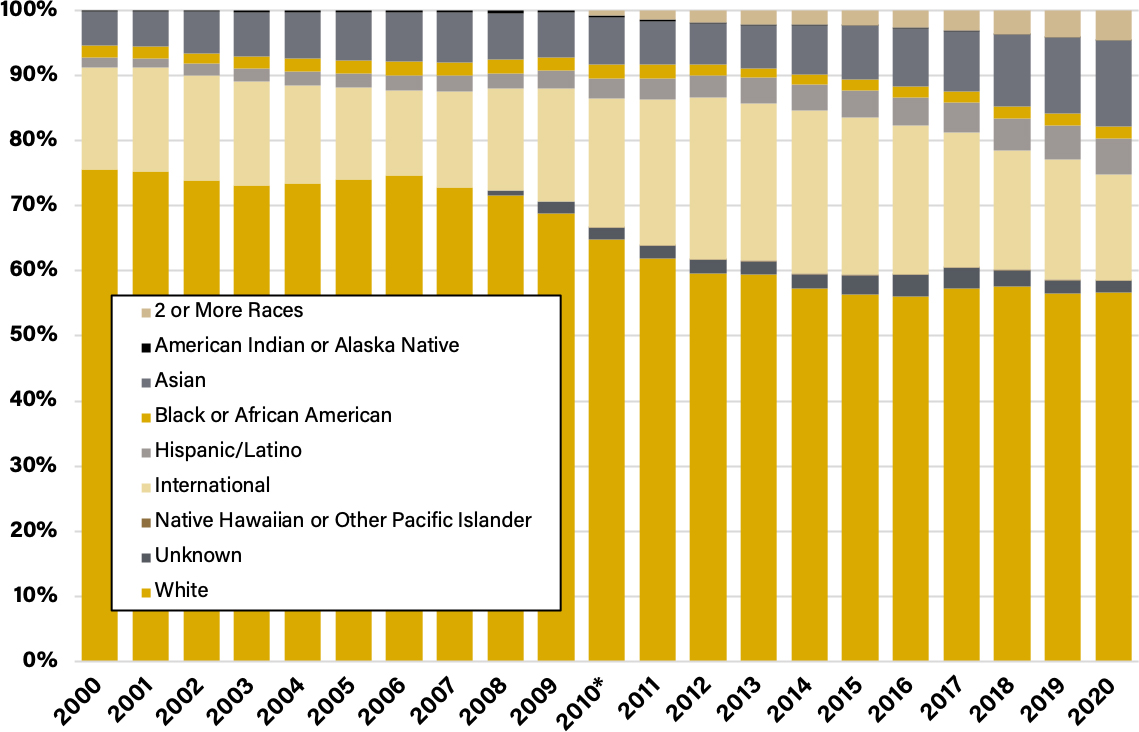
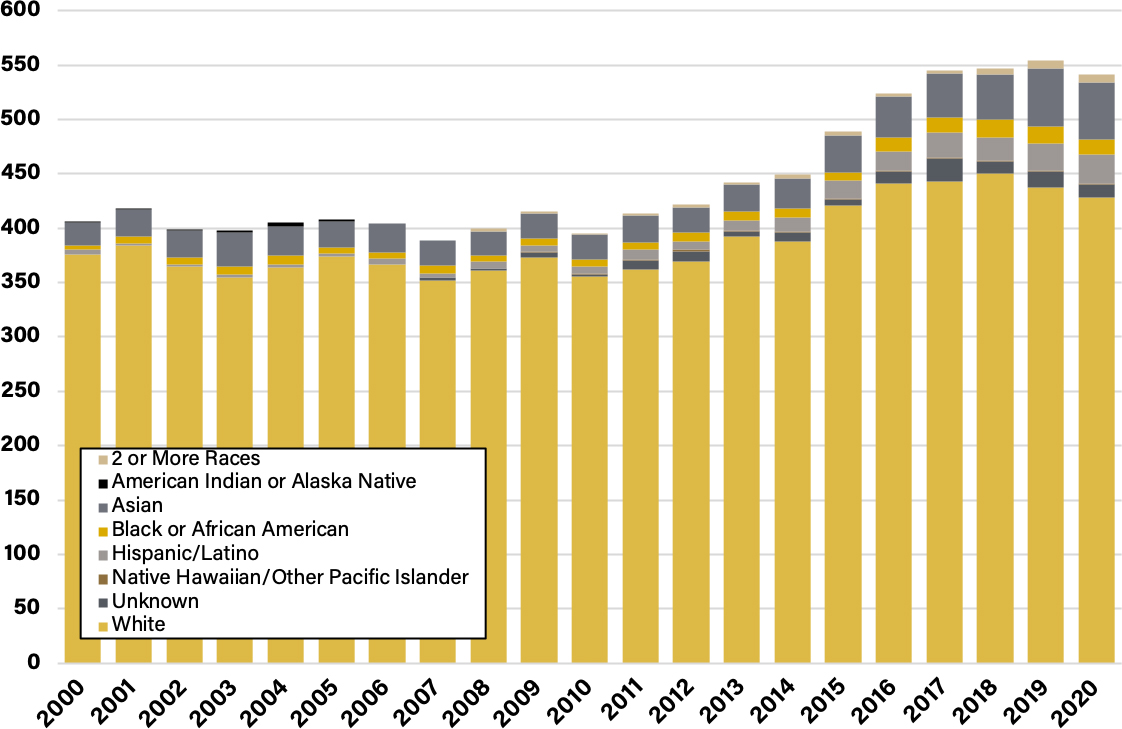
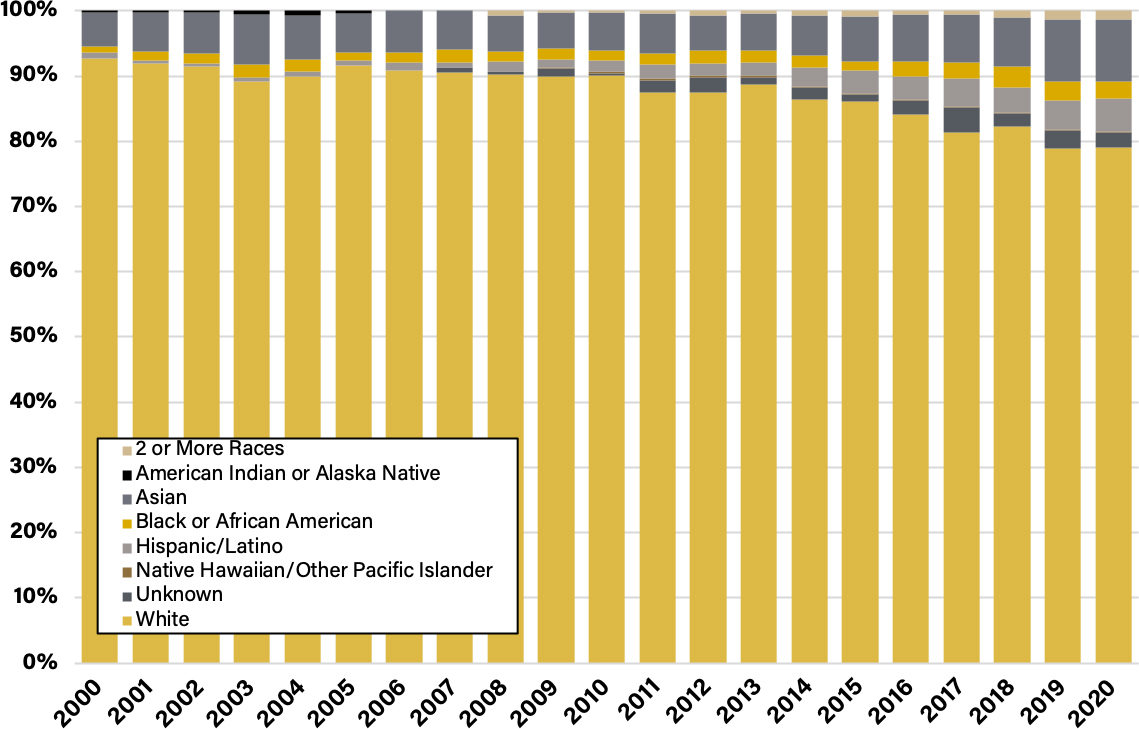
*In 2010 the IPEDS standard modified Hispanic/Latino student reporting by changing the "Hispanic/Latino" option from a race to an ethnicity, resulting in domestic students identifying as Hispanic/Latino being counted as such regardless of their self-identified race. Additionally, "Native Hawaiian or Other Pacific Islander" was introduced as a new race option, and students were allowed to select more than one race. These multi-racial students are counted in the "2 or More Races" category regardless of the individual races selected.
Prior to 2008, "Unknown" students—those who did not select any race—were included in the "White" category.
Undergraduate Students by Race/Ethnicity, 2000-2020
Undergraduate Students by Race/Ethnicity, Percentage of Whole, 2000-2020
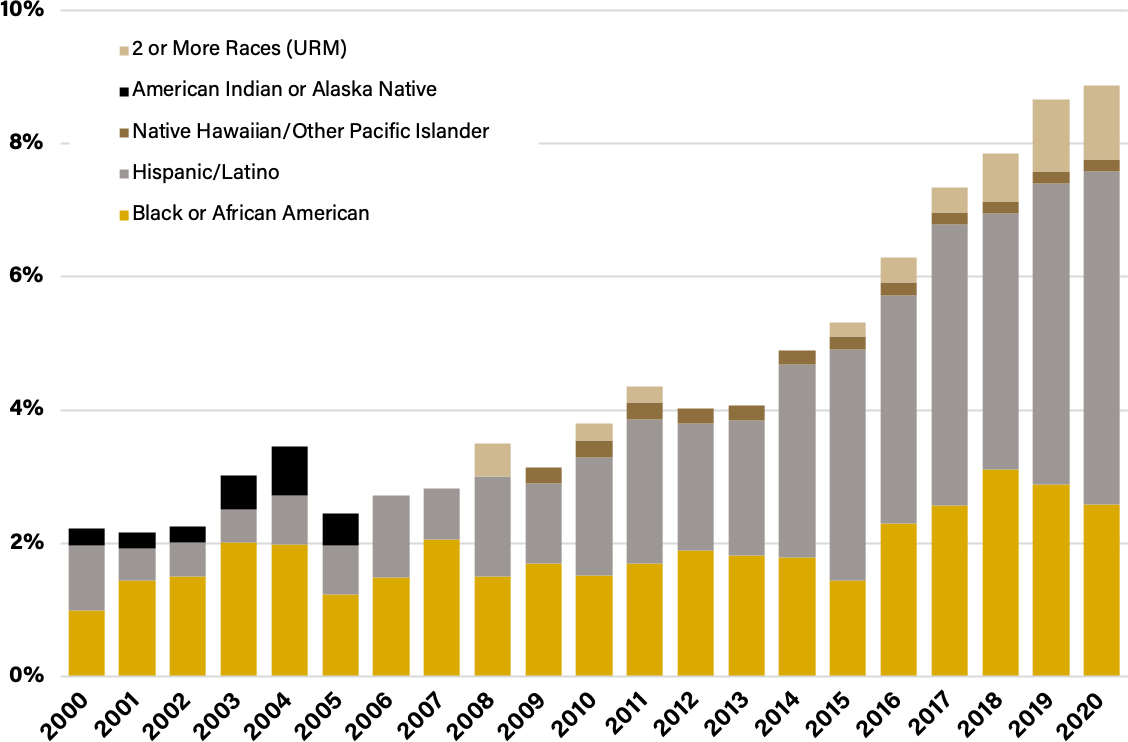
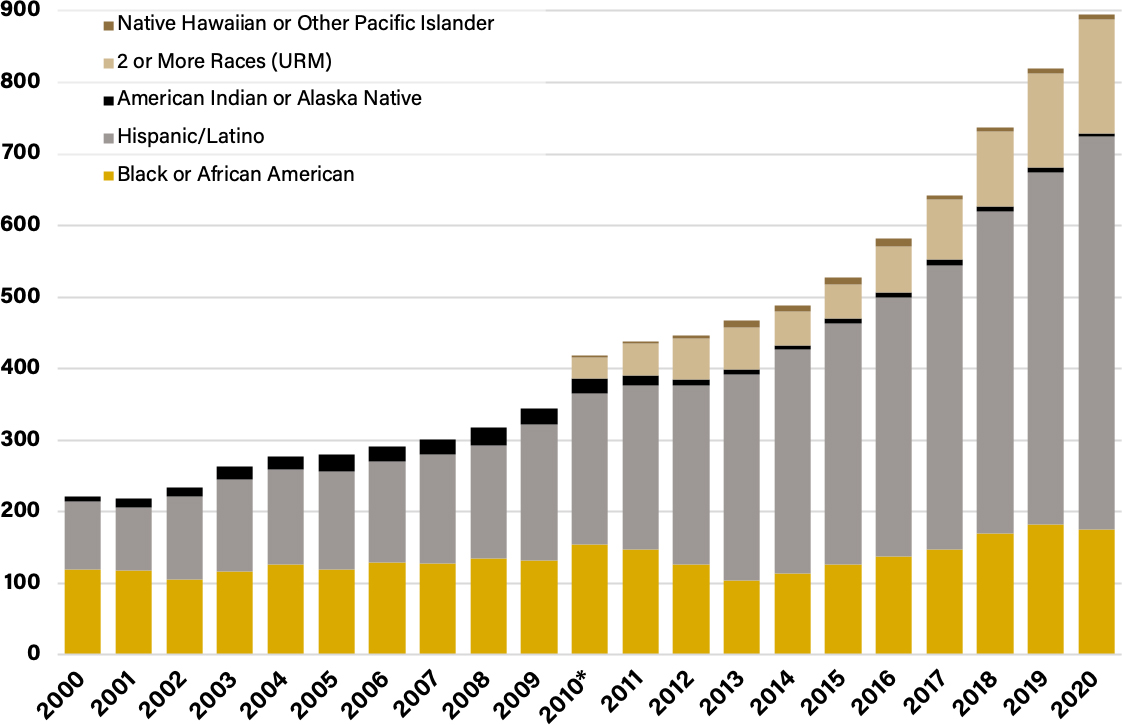
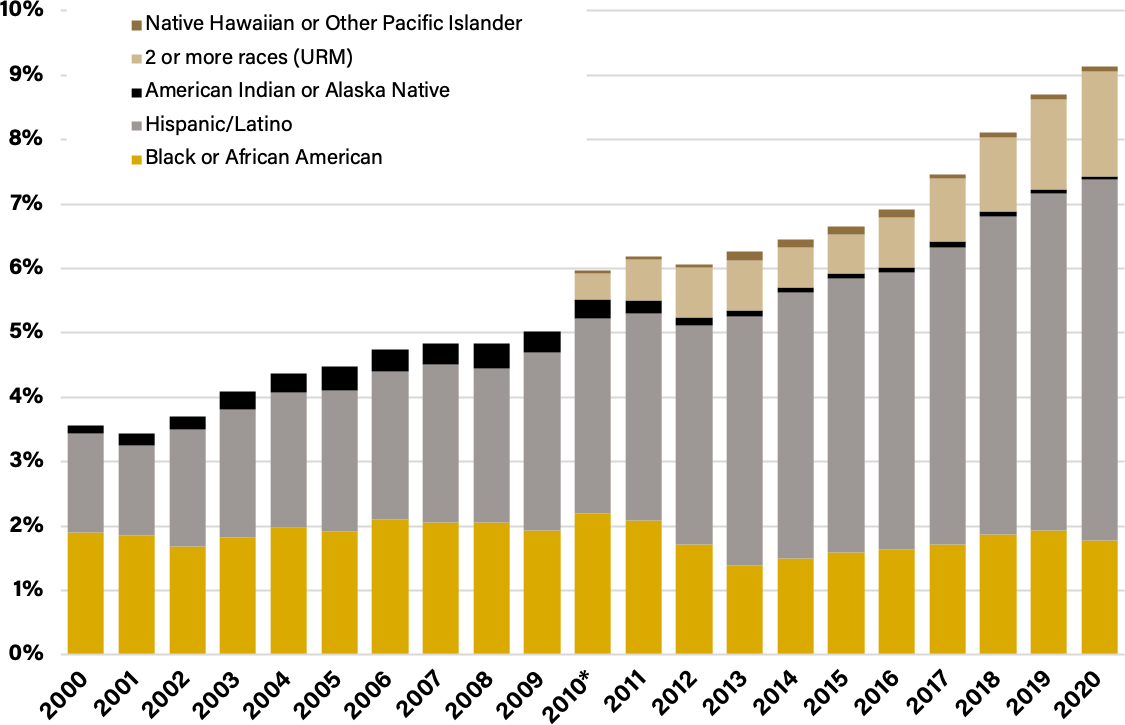
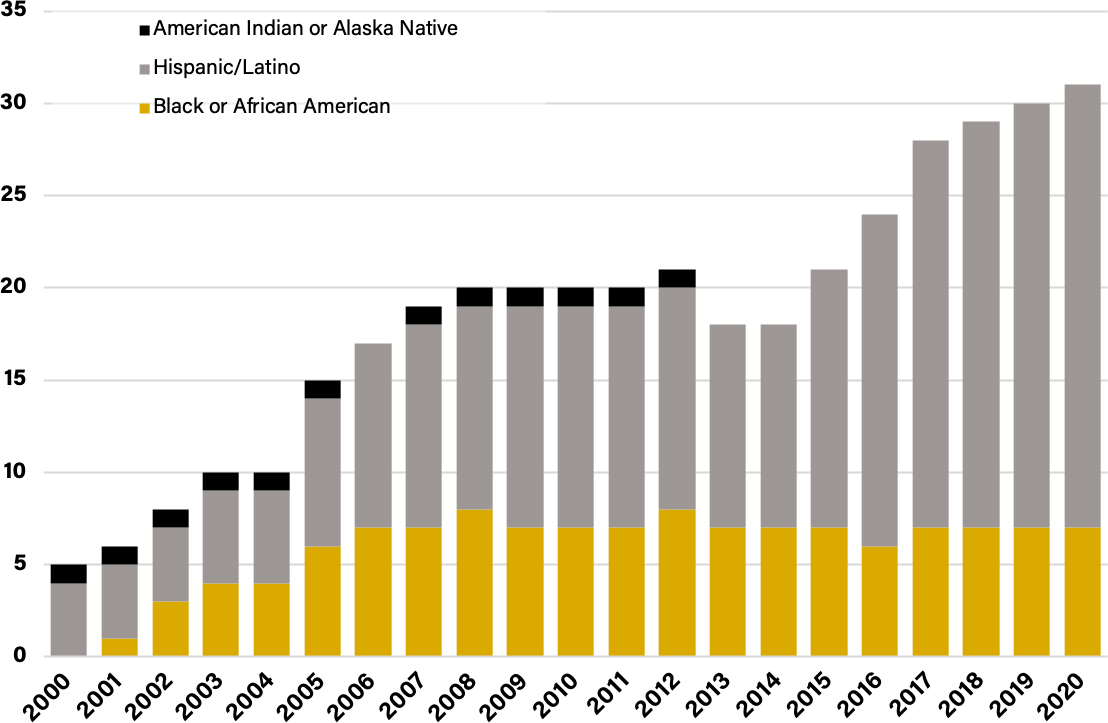
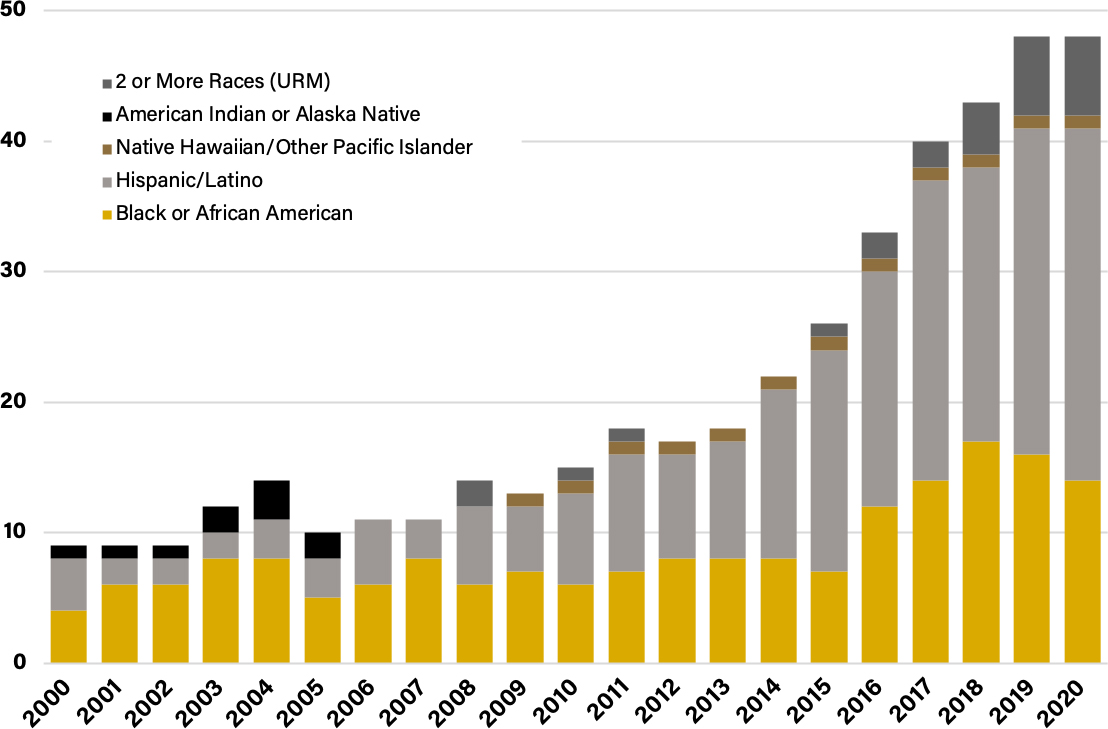
Undergraduate URM Students by Race/Ethnicity, 2000-2020
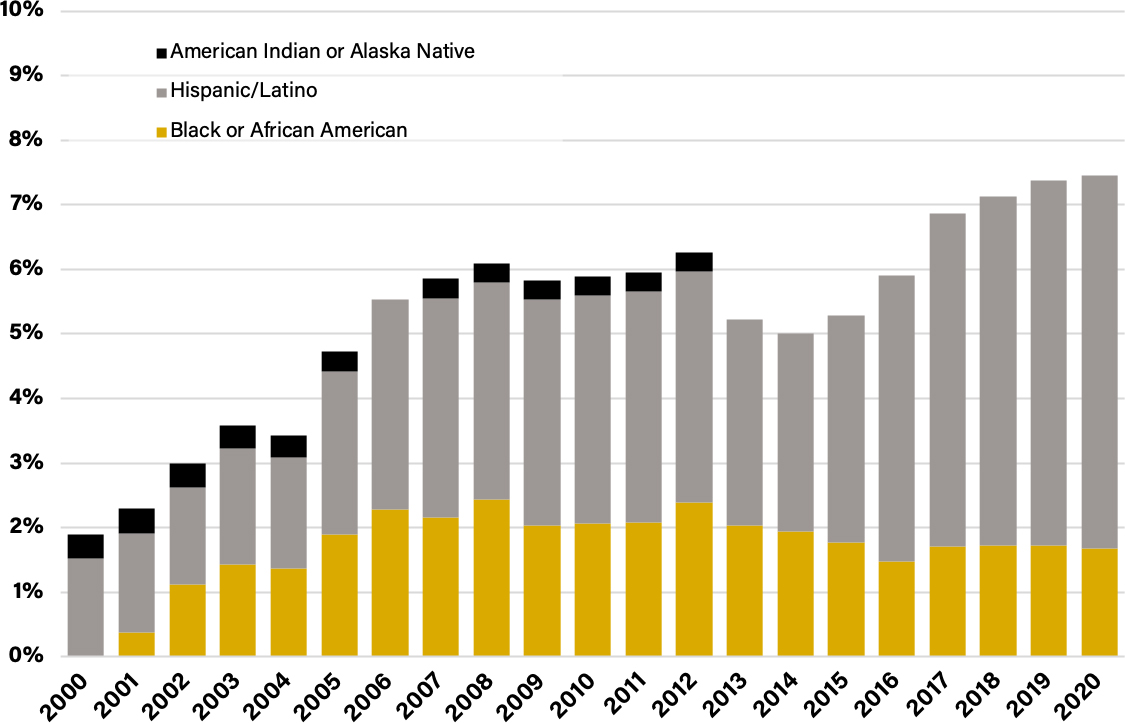
Under-represented Minority (URM) students are defined by Purdue as domestic students who identify as "Black or African American," "Native American or Alaska Native," "Native Hawaiian or Other Pacific Islander," and "Hispanic/Latino" as well as multi-racial students who select one of the aforementioned races.
Multi-racial URMs are counted in the "2 or More Races (URM)" category, which is a subset of "2 or More Races" shown in other graphs.
URM Undergraduate Students by Race/Ethnicity, Percentage of All Undergraduates, 2000-2020
Faculty by Race/Ethnicity, 2000-2020
Race and ethnicity are self-reported by faculty using the Affirmative Action reporting standard. International faculty are counted in their self-reported race, which differs from the standard for counting international students.
Employees who do not provide their race or ethnicity identification are counted as "Unknown." Prior to 2007, such employees were aggregated in the "White" category.
Faculty by Race/Ethnicity, Percentage of Whole, 2000-2020
URM Faculty by Race/Ethnicity, 2000-2020
No "Native Hawaiian or Other Pacific Islander" nor "2 or More Races" where one of the races was URM were reported during these years.
Percentage of URM Faculty by Race/Ethnicity, 2000-2020
Staff by Race/Ethnicity, 2000-2020
Race and ethnicity are self-reported by employees using the Affirmative Action reporting standard. International employees are counted in their self-reported race, which differs from the standard for counting international students.
Employees who do not provide their race or ethnicity identification are counted as "Unknown." Prior to 2007, such employees were aggregated in the "White" category.
Staff by Race/Ethnicity, Percentage of Whole, 2000-2020
URM Staff by Race/Ethnicity, 2000-2020
Multi-racial URMs are counted in the "2 or More Races (URM)" category, which is a subset of "2 or More Races" shown in other graphs.
Percentage of URM Staff by Race/Ethnicity, 2000-2020