Indiana Flood Map and Damage Estimate online with Google Earth
 A Google Earth view is available at https://engineering.purdue.edu/CE/floodmaps/2008_flood_map.htm
For this website, you can evaluate the flood extents and estimated crop damages along with other geospatial layers provided by Google Earth. A chart summary of the crop damages in 9 counties in southwest Indiana is available at https://engineering.purdue.edu/CE/floodmaps/damage_chart.pdf
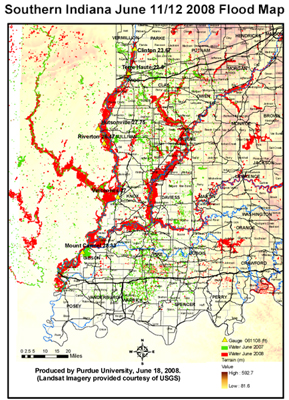
The Indiana flood maps are produced by using Landsat satellite images as the primary data source. The images were acquired in June 11-12 2008 during the flooding period and made available courtesy of USGS. Object-based image classification techniques are used to extract the water areas from the imagery. Flooding areas are shown in RED. Basic geographic information, including topographic elevation, county and city maps, road networks, and rivers are overlaid for reference. The gauge data (water depth, June 11 2008) are acquired from NOAA and labeled in the map. For comparison, the water areas in June 2007 (only west part of the map at this time) are also detected from Landsat images and are shown in GREEN in the map.
The flooding maps are provided at three resolutions: (all are in pdf format)
High (600dpi – 15MB)
Medium (300dpi – 2.6MB)
Low/Quick View (100dpi – 0.8MB).
For comments and questions, please contact Prof. Jie Shan at jshan@ecn.purdue.edu