Taylor Vortex PIV page
Mechanical Engineering |
Taylor Vortex PIV page
Mechanical Engineering |
Particle image velocimetry or PIV is a routine method for simultaneously measuring two components of a fluid's velocity at a large number of spatial points. While there are many different adaptations of PIV, they all share several components. First, the flow being measured is seeded with small tracer particles that accurately follow the velocity fluctuations that are being measured. Second, the flow is illuminated by a sheet of light at least twice. Third, the particle positions during each illumination are recorded by a camera. The fluid's velocity within the light sheet is found approximately by calculating how far the particles moved between each illumination and dividing by the time between illuminations.
In this work, we used a TSI, Inc. PIV system. Our system features a 10 Watt multi-line Ar-Ion laser as the illumination source. We record our particle images using a custom cross-correlation CCD camera available from TSI, Inc. The experimental apparatus is shown here. While this camera has a standard RS-170 interlaced signal out at 30 frames per second, it has on-board memory that allows us to shorten the time between light pulses to the microsecond range where a standard RS-170 camera would be limited to a minimum time between pulses of 16.7 milliseconds. This choice of camera allows us to measure velocities as a function of both space and time with moderate resolution in both space and time.
TSI, Inc. offers a package called Insight to both acquire and analyze the particle images. While the analysis portion of Insight performs all the tasks we wish, we have found it necessary to augment Insight's acquisition capabilities with our own acquisition code called SEQGRAB. With SEQGRAB we can acquire up to 16,500 small images at the RS-170 rate of 30Hz. This large number of images allows us to use PIV for frequency or spectral analysis, a task for which it is not been used in the past due to the generally small number images available for analysis. For more information about SEQGRAB please contact me personally.
 Using
SEQGRAB I measured the power spectral density of the radial and axial velocity
components of wavy Taylor vortex flow, a time-dependent, periodic flow.
The complete data set consisted of 16,384 individual 32 by 90 pixel images.
Each pair of images was cross-correlation analyzed at three spatial points
using Insight with a 32 by 32 pixel interrogation window, resulting in
8,192 radial and axial velocity measurements at three different spatial
positions. Because the images are cross-correlated to calculate velocities,
each successive pair of images produces one set of velocity measurements.
The final data set consists of radial and axial velocity data at three
spatial locations for 8,192 time steps each separated by 1/15 second. As
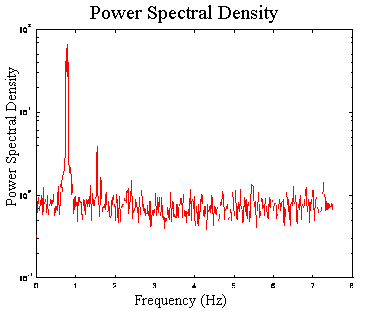
an example of what can be done with these data, I computed the power spectrum
for each velocity component for each spatial point and then ensemble averaged
these spectra. The resulting power spectrum is shown in the neighboring
figure. Using the PIV in this manner provides information that formerly
had to come from an LDV or a hot wire anemometer. Although the data rate
is low, only 15Hz, experiments which are optimized for the lower resolution
digital PIV are not typically amenable to LDV because of the disparate
particle sizes required by each process. Hence, adapting a PIV to perform
LDV may be the only option in certain circumstances.
In our recent experiments we have made two sets of measurments for each wavy Taylor vortex flow examined. One set of measurements is a long time measurement over a small area of the flow which issuitable for measuring the frequency of the waviness. The other set of measurements, made for a shorter time over a larger region is suitable for examining the spatial structure of the vortices. Since wavy Taylor vortex flow is periodic, we cannot average many consecutive measurements to minimize random uncertainties as with a steady-state phenomenon. What we can do however is use the peak in the power spectrum to accurately determine the fundamental frequency of the waviness and average measurements from consecutive periods of the wave. Below is an animated GIF example of this averaging covering an entire period of the waviness. You can also download a movie version of the wavy vortices in motion. The red asterisks show the present locations of the vortex centers while the white pluses show the past locations of the vortex centers. For those of you familiar with Taylor vortices, the inner cylinder is at the top of the figure.